Finance lesson introducing mortgages pay slipsQuick View
lindsayu

Finance lesson introducing mortgages pay slips

(0)
<p>This lesson is ideal for doing with Y11 students once they have done their GCSE exam. Or it can be used in a maths lesson when you have access to computers, or as an end of term lesson.</p> <p>It begins by projecting up various finance words (01) and asking students to match these to definitions.</p> <p>There are then some basic mortgage questions (02), for example what would a 15% deposit be on a house of this value.</p> <p>The main part of the lesson is on take home pay (03). Students will be given a few minutes to think about their dream job. If they have their own computers they can do this, or I have included a list of average salaries from a few years ago as a back up (04).</p> <p>I have created a template for students to use in order to show their calculations for each deduction. 1 tick means easier; 2 ticks mean harder.</p> <p>There is no set answer to this as each student will be calculating different things. The purpose of this lesson is to really understand the basic finance terminology we use in day to day life and to be able to glance through a pay slip and do some basic checks to see if it looks correct.</p> <p>(Computers are not essential for this lesson - they can be used for students to research average salaries for their chosen career and to read the information on NI and tax on their own. The teacher can project this up otherwise, which is what I did.)</p>
Time series line graph lesson, data handlingQuick View
lindsayu

Time series line graph lesson, data handling

(0)
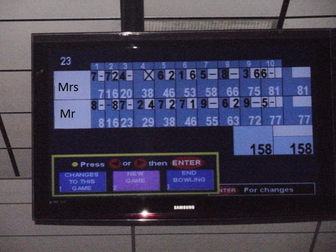
<p>This full lesson has been used multiple times, including in observed lessons. Students enjoyed it and received very good feedback. It was supplemented by exam questions, which I have not included. It uses a real life example of bowling scores in order to draw line graphs. Can they draw a time series line graph? (There is an exemplar drawing for them to compare theirs to.) Can they predict trends? Can they look at any line graph and analyse them? Also includes a peer assessment grid. I’ve included a word document with a few bullet points on how to use the resources.</p>
The data handling cycle fun projectQuick View
lindsayu

The data handling cycle fun project

(0)
<p>Once you have covered the data handling cycle; collecting / interpreting / representing it; this is a great activity to do, especially at the end of term. Has a focus on peer assessment. I’ve used this multiple times and it always goes down well. You will need to download a music clip in advance (please ensure it is appropriate). Mini project which lasts a lesson. Word document has some bullet points of how to use the resource.</p>
Introducing the median extending to IQRQuick View
lindsayu

Introducing the median extending to IQR

(0)
<p>This lesson introduces finding the median. It is very scaffolded to draw and reinforce the concept that numbers must be in ascending order. Some of the resources will need cutting out by teacher or student. Differntiated. Extends to finding lower quartile, upper quartile and interquartile range. Also includes a powerpoint on finding the median from the position number / formula. Word doc has some bullet points on how to use the resources.</p>
Writing algebra and substitutionQuick View
lindsayu

Writing algebra and substitution

(0)
<p>This contains 3 resources: 1) Algebra literacy starter match up powerpoint (project); understanding equation / term / expression / formula. 2) I think of a number activity word document (print) - 3 quick questions looking at algebra notation / writing algebra. The point of this is to identify any misconceptions before moving into substitution. 3) Making your own substitution questions - 3 slides. The first to be projected; value is given in the centre with various questions around it (answers available). The other two slides are differentiated, one easier (positive value) and one harder (negative value). Students should write their own questions and answers. They can swap their questions and work on each others questions, then peer assess.</p>
Collecting like terms low ability studentsQuick View
lindsayu

Collecting like terms low ability students

(0)
<p>Introducing collecting like terms to very low ability students. Some schools will expect you to follow the scheme of learning with the low ability students but there are often limited resources available to cater for some topics. These activities start by simply matching random symbols together. Then there are some cards (you will need to print and cut out) with different letters. Word document explains how to use the resources.</p>
Expanding and factorising bracketsQuick View
lindsayu

Expanding and factorising brackets

(0)
<p>Expanding and factorising single and double brackets when revising algebra. These are no frills but effective; differentiated (two levels, easier and harder) resources and used many times. The main resource has answers available to project; the starter and extension activity does not. Word document is included with further guidance on how to use the resources.</p>
Line graph time series full lesson maths KS3 KS4 GCSEQuick View
lindsayu

Line graph time series full lesson maths KS3 KS4 GCSE

(0)
<p>Interpret time series line graphs and draw them from tables of data.</p> <p>I’ve used this lesson with various year groups and various ability levels through KS3 and KS4. It begins by looking at a real life tourism line graph (visitors to and from the UK over time; from Gov) and asks students to analyse it. Scaffolded materials are provided, either an instructions hand out with points to consider or a table to insert specific answers. Moving on to comparing and contrasting two different line graphs. There is a blank Venn diagram if you want to use this for recording the answers, or it could be done verbally or on mini-whiteboards. Photographs of scores from ten pin bowling are included and students draw line graphs from the data. I have also included an exemplar line graph for students to self-assess against. There is also some data on numbers of cars on a street over time (this is not verified) for students to pull both skills together, drawing a line graph then analysing it.</p>
Year 1 spellings from 2014 National CurriculumQuick View
lindsayu

Year 1 spellings from 2014 National Curriculum

(0)
<p>Includes a powerpoint containing over 300 spellings from Year 1 National Curriculum (2014). Printable as only contain limited colour whilst still eyecatching enough to project. Perfect for laminating. The spellings are over 4 slides, each with 7 columns / 11 rows. These have been taken directly from the NC document, along with a few similar words. They are at random - they are not categorised by sound. The powerpoint has 2 different designs, the 4 slides are in 2 different colours / patterns. Also included is an excel file with one master list of all the spellings. There is also a randomly generated list of 10 spellings. (As this is a random list when you generate one you may get duplicates. The list will keep regenerating so if you want to save a particular list you will need to copy it, then use the “paste values” option. Useful for spelling tests or spelling homework.</p>
Maths revision borderline studentsQuick View
lindsayu

Maths revision borderline students

(0)
<p>Maths home learning; quick reference powerpoint. Originally made for a lower ability foundation group who had very aspirational targets of a C. This was printed for them (6 slides to a page) to help them cram for the exam. This does not go into the depths of each topic. It is 78 slides and key points for common topics. Would also be really useful right now when having to home study. Also used in tutor time for revision with non specialists. Can be displayed on screens when going into the exam. This is not an exhaustive revision list.</p>
Drawing pie charts lessonQuick View
lindsayu

Drawing pie charts lesson

(0)
<p>Sequence of activities that looks at drawing pie charts. Full lesson worth of materials for introducing pie charts or recapping them with low ability groups. Why do we use pie charts? What are the relationships to circles? Some angle drawing skills included in the starter along with using a calculator for inverse operations. Word document includes further instructions for using the resources.</p>
Drawing linear graphs consolidation revisionQuick View
lindsayu

Drawing linear graphs consolidation revision

(0)
<p>This consolidates drawing linear graphs in the form y=mx+c. Students should have already been introduced to drawing straight line graphs using a table of values, with this lesson letting them practice the skill and extending the learning (to start deducing what y=mc+c means and also looking at linear graphs where y is not the subject). This lesson focuses on consolidating learning and deducing. Used multiple times with proven success. Doesn’t have the drawn graph as answers.</p>
Blooms taxonomy resources sequences algebraQuick View
lindsayu

Blooms taxonomy resources sequences algebra

(0)
<p>Three resources included here. The first is a simple powerpoint looking at extending sequences and identifying/describing the number patterns. The other two are activities which are based on Blooms Taxonomy; one on linear sequences and one on quadratic sequences. Although on powerpoint they are designed to be printed (can print A4 then double sided; or if students ok with small font can print multiple to a page then cut out and stick in book). The activities use wording from Blooms, these are highlighted in bold. So each one is sort of like a ladder, with each question getting more challenging and needing more complex thinking skills.</p>
Learning objective and questions slides algebra mathsQuick View
lindsayu

Learning objective and questions slides algebra maths

(0)
<p>Some schools are super strict about having learning objectives up, this could be a really useful folder for maths teachers / supply teachers / cover teacher. Each file contains just two slides. The first slide will have date / learning objective / key words. The second slide will have the same but instead of a learning objective it turns it into a learning question. This can then stimulate a discussion or give the students something to reflect on as a walk in starter and hooks them into the lesson. Here is an example for collecting like terms… the learning objective could be “To be able to collect like terms when there are different letters within the question.” The learning question however could be “In the question “3a + 4b” is the answer 7ab?” This then turns the use of a learning objective into a more useful exercise. 21 different algebra topics have these written up in a consistent manner. There are no other lesson materials included. These slides give consistency to the start of your lesson no matter what other materials you are using. The date is programmed to update automatically.</p>
Jollies - going on holiday functional mathsQuick View
lindsayu

Jollies - going on holiday functional maths

(0)
<p>This is a good cover lesson or end of year activity. Real life, functional maths. It contains all the different maths you may encounter when booking a holiday: exchange rates; temperature charts; deposits and percentage discounts etc. 2 pages of questions on a word document, designed to be printed, can do 2 to a page to save paper.</p>
Great British Sewing Bee maths questionsQuick View
lindsayu

Great British Sewing Bee maths questions

(0)
<p>Maths questions inspired by the TV show The Great British Sewing Bee. 6 slides each taking approximately 5 minutes each. Most suitable for KS3. Functional maths. Covers money questions including simple percentage discount; main focus is metric conversions for length; area; exchange rates (this one is more challenging). In a powerpoint with introduction and answers. I’ve also included a print friendly version - use the print option of handout 6 to a page.</p>
Types of sampling powerpointQuick View
lindsayu

Types of sampling powerpoint

(0)
<p>This is a very quick powerpoint, just 4 slides with a definition of random; systematic and stratified sampling. It does not have specific examples for each, it is to introduce a group to the concept that there are different ways to choose a sample.</p>
Reciprocals starter leading to perpendicular linesQuick View
lindsayu

Reciprocals starter leading to perpendicular lines

(0)
<p>Very simple but effective starter on reciprocals, leading to perpendicular lines. Table is designed to be printed. First column gives a number, second column asks them to find the reciprocal, next the negative reciprocal and finally the product of the previous two. This can then lead on to perpendicular lines in linear / straight line graphs.</p>
Index laws - introducing multiplying and dividingQuick View
lindsayu

Index laws - introducing multiplying and dividing

(0)
<p>The temptation is to give students the rules and get them to do a few questions. This skips a stage though as they don’t understand why the rule exists. It only takes 5 minutes to explain how you are manipulating the expression and why the rule is a shortcut. This powerpoint is basic, it gives the tables and structure to explaining the topic but does not give questions - this was done purposefully so I could write these on the board from the top of my head depending on how the ability levels of the kids and how quickly they got it (e.g. could move to three expressions).</p>
Getting to know you activity - maths - start of yearQuick View
lindsayu

Getting to know you activity - maths - start of year

(0)
<p>At the start of the year I usually spend one maths lesson doing all the admin: handing out books; setting expectations and discussing classroom routines; introducing myself and easing the pupils in. Here are a couple of different options, designed to be printed A5 and stuck into front page of exercise book. One is Q&amp;A style; one has sentence starters. Also gives you an idea of literacy levels of the students and is a way to get to know them.</p>