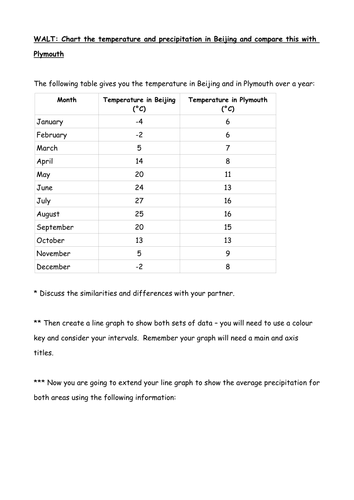

This uses the weather data for Beijing, China and Ply mouth, UK to compare and draw a line graph. It can be adapted to use your own local weather data.
It extends the students' knowledge of drawing line graphs as they need to use 2 opposite axis and design a key to clarify.
It extends the students' knowledge of drawing line graphs as they need to use 2 opposite axis and design a key to clarify.
Something went wrong, please try again later.
This resource hasn't been reviewed yet
To ensure quality for our reviews, only customers who have purchased this resource can review it
Report this resourceto let us know if it violates our terms and conditions.
Our customer service team will review your report and will be in touch.
£3.00