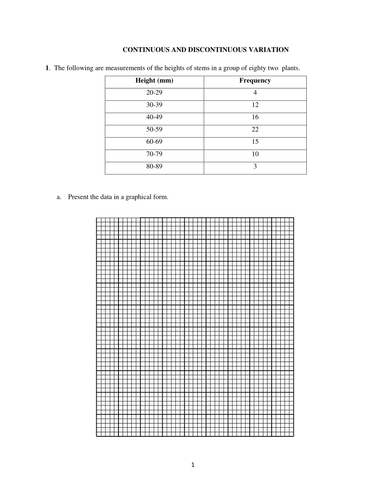
The resource offers students the chance to learn and improve on their skills of presenting quantitative and qualitative data in graphical forms. It would make students appreciate when to present data as histograms and when to present as bar charts. The resource should be used after teaching biological variation. Answers have been provided to the questions.
Get this resource as part of a bundle and save up to 38%
A bundle is a package of resources grouped together to teach a particular topic, or a series of lessons, in one place.
Something went wrong, please try again later.
This resource hasn't been reviewed yet
To ensure quality for our reviews, only customers who have purchased this resource can review it
Report this resourceto let us know if it violates our terms and conditions.
Our customer service team will review your report and will be in touch.
£3.00
