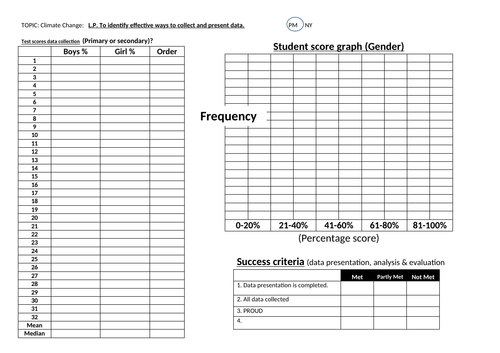
A worksheet to use with pupils post assessment.
Students firstly create a percentage from their test score.
They then collect data from their peers and fill in the table.
Once completed, they order the data and calculate the mean & median.
They then plot the data as a stack graph or double bar graph (boys & girls).
To finish, they complete the target setting sheet.
Data can be analysed once all elements have been done.
Can be used with all year groups, but works well for KS3.
Something went wrong, please try again later.
This resource hasn't been reviewed yet
To ensure quality for our reviews, only customers who have purchased this resource can review it
Report this resourceto let us know if it violates our terms and conditions.
Our customer service team will review your report and will be in touch.
