


I created this resource for my year 10 class and they loved it!
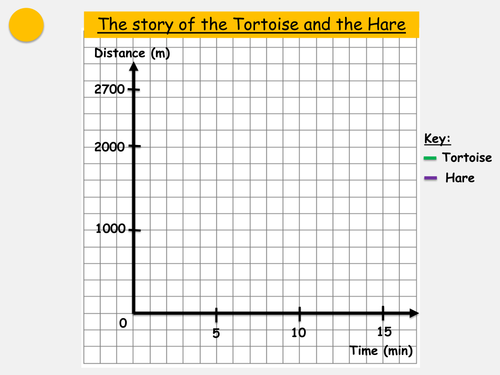
It is an investigation task that they can do in group. The aim is to plot the distance time graph of the Tortoise and the Hare story. Then there are a few questions to they have to answer, using their graph. Answers are included in the presentation as well as differentiated student answer sheets on which they need to plot their graph.
It is an investigation task that they can do in group. The aim is to plot the distance time graph of the Tortoise and the Hare story. Then there are a few questions to they have to answer, using their graph. Answers are included in the presentation as well as differentiated student answer sheets on which they need to plot their graph.
Something went wrong, please try again later.
Report this resourceto let us know if it violates our terms and conditions.
Our customer service team will review your report and will be in touch.
£0.00