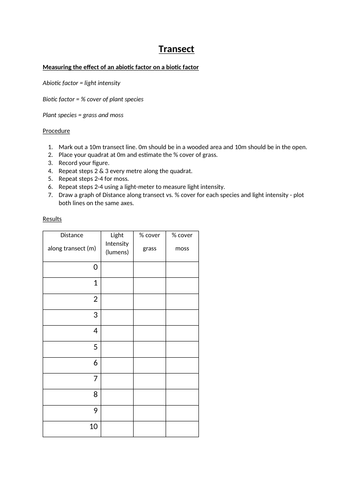
Simple procedure to investigate how an abiotic factor (light intensity) affects biotic factors (% cover of two plant species). Pupils will already need to know how to use quadrats and how to estimate % cover.
A 10m transect is measured out from a wooded area to an open area. Every metre, light intensity, % cover of grass and % cover of moss are recorded. All these can then be plotted on a line graph to show how they change along the transect. Conclusions can then be drawn about how light intensity affects each species. Also, the ideas of tolerance and competitiveness in plant species can be introduced.
Something went wrong, please try again later.
This resource hasn't been reviewed yet
To ensure quality for our reviews, only customers who have purchased this resource can review it
Report this resourceto let us know if it violates our terms and conditions.
Our customer service team will review your report and will be in touch.
