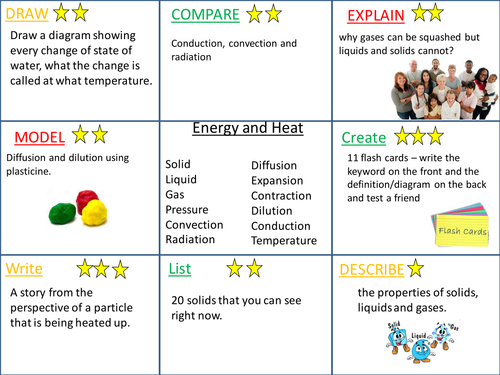

This resource is differentiated by task and also by time to be spent on each.
Red activities = hardest,
Orange = medium demand
Green = easy
The stars represent the time to be spent on each ( I change this depending on the ability of the group/ student e.g. each star represents 2 minutes)
I usually display on the board and students work on A3 or print for lower ability classes.
Get this resource as part of a bundle and save up to 55%
A bundle is a package of resources grouped together to teach a particular topic, or a series of lessons, in one place.
Something went wrong, please try again later.
Report this resourceto let us know if it violates our terms and conditions.
Our customer service team will review your report and will be in touch.
£3.00