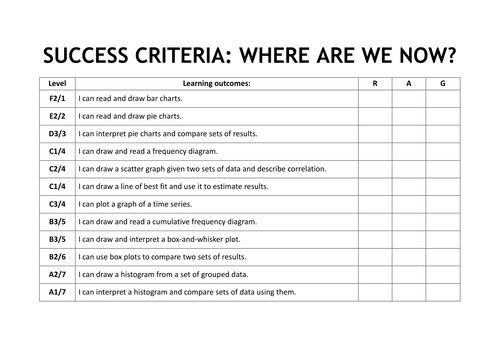

This is a powerpoint covering all types of statistical graph from pictogram to histogram with lots inbetween. It contains brief notes by way of an explanation, model answers to questions and a question or two for the students to do; all of the questions come with answers that you can display when ready. The slide show comes with a progress grid (regularly referred to in the presentation) so that students can mark their progress from start to finish and pinpoint any areas that may need extra work with a “red/amber/green” system that they fill in; each one is given an approximate grade in both new (2017 onwards) and old system in England. It’s what I use in my lessons before setting tasks from worksheets or text books to practise.
Something went wrong, please try again later.
This resource hasn't been reviewed yet
To ensure quality for our reviews, only customers who have purchased this resource can review it
Report this resourceto let us know if it violates our terms and conditions.
Our customer service team will review your report and will be in touch.
£1.00
