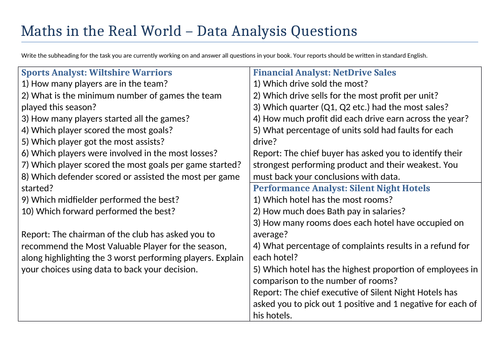


This is a project lesson for 50 - 75 minutes based around interpreting data, understanding proportions, calculating percentages and statistical enquiry. The theme of this lesson is to emphasise the importance of data analysis in varied fields of life, and includes three specifically designed data sets based around sports, performance and financial analysis.
Students will have to answer a series of questions related to the 3 data sets to help prepare them to write a mini report detailing their findings.
These questions and level of data analysis are similar to what many companies use as the basis of their graduate recruitment maths tests, with candidates expected to interpret data in different forms and draw correct conclusions based on sound explanations.
Having ran this session multiple times, students are very engaged with the content and like seeing how maths will be used in real work places. It could be done in classes, or as a larger scale event. I usually run it as a carousel, with different data sets on each table and getting students to rotate around, but again delivery is flexible.
The 3 data sets are:
Sports Analysis - Wiltshire Wanderers. Students have to evaluate player performance over a season by working out things such as number of goals scored per game.
Financial Analysis - Netdrive Sales. Students have to evaluate sales performance of 4 products, calculating things such as most profitable periods, profit per item and percentage profit.
Performance Analysis - Silent Night Hotels. Students look at the performance of various hotels in a fictional chain and pick out positives and negatives of each one.
Something went wrong, please try again later.
This resource hasn't been reviewed yet
To ensure quality for our reviews, only customers who have purchased this resource can review it
Report this resourceto let us know if it violates our terms and conditions.
Our customer service team will review your report and will be in touch.
