

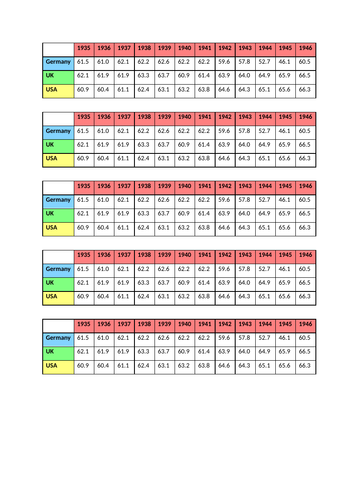
Powerpoint and print out of practice plotting time series table of values.
This powerpoint contains a set of key things to identify when interpreting time series graph and an activity to draw a graph.
Normally it takes learners/pupils a long time to draw axes and plot points but this variation of a Kagan activity works really well. All 4 learners in a group work on their own graph to start with. After 2 minutes they swap sheets with another member of their 4 and continue the work of another person. This swapping continues until they have 4 complete time series graphs. A great way for them to spot misconceptions and to learn from each other.
Something went wrong, please try again later.
no booklet
Report this resourceto let us know if it violates our terms and conditions.
Our customer service team will review your report and will be in touch.
£3.00