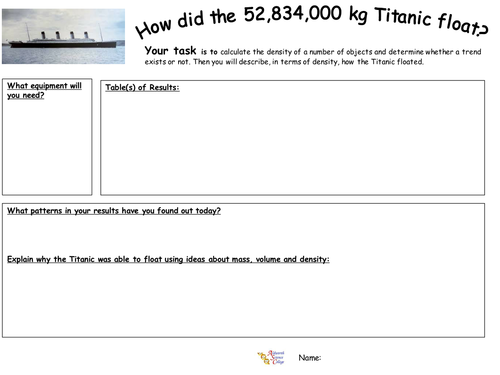


This is for 20 APP resources that cover areas about investigations, plotting graphs, analysing data and risk assessing.
They cover Year 7, Year 8 and Year 9. They are all practical based activities (either experiment or using data) and they each take a whole lesson.
Print them out on A3 yellow paper so you can easily locate them in student's books.
Each APP task is write in boxes on one side. Other side is success criteria, teacher and student somment boxes. Very easy to mark, just highlight the criteria students attained.
Year 7:
Graph Drawing Sycamore Seeds
Trends and Patterns Titanic Density
Risk Assessment of Neutralisation
Plan Separation Techniques
Secindary Sources for Frictional Forces
Tabulating Data of Light Intensity
Year 8:
Why do People Smoke SMSC
How Much Fat Is In a Crisp Tabulate Data
What's So Special About Alkali Metals Trends and Patterns
Burning Magnesium Data Analysis
Electromagnets Drawing Graphs
Streamlining with Plasticine Evaluation of Procedure
Year 9:
Should Cannabis be Legalised Application of Data
Holly Leaves and Prickles Interpreting Trends
Rates of Reaction Evaluating Procedure
How Do You Make A Salt PLan an Investigation
What Crushed My Can Explaining Evidence
Resistance Of A Wire Presenting Data
Quadrats gathering Information
Salol Risk Assessment
I designed these so they could be used to prepare students for the skills needed at GCSE. Our department made them a priority.
Something went wrong, please try again later.
This resource hasn't been reviewed yet
To ensure quality for our reviews, only customers who have purchased this resource can review it
Report this resourceto let us know if it violates our terms and conditions.
Our customer service team will review your report and will be in touch.
£11.00
