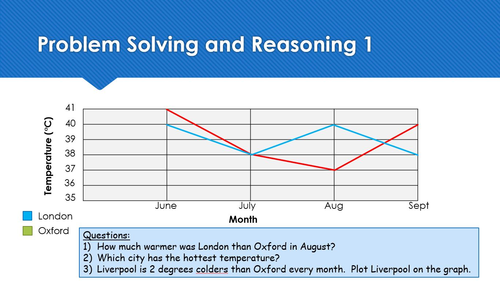


Includes a zip file of 6 editable PowerPoint presentations based on the teaching guidance provided by WRMaths for Autumn Block 3 Statistics.
There is one presentation to support teaching for each of the following small steps:
- Read and interpret linegraphs
- Draw line graphs
- Use line graphs to solve problems
- Read and interpret tables
- Two-way tables
- Timetables
Each PowerPoint includes a warm up task.
Get this resource as part of a bundle and save up to -14%
A bundle is a package of resources grouped together to teach a particular topic, or a series of lessons, in one place.
Something went wrong, please try again later.
All the resources from this author are excellent and time saving.
Report this resourceto let us know if it violates our terms and conditions.
Our customer service team will review your report and will be in touch.
£4.00