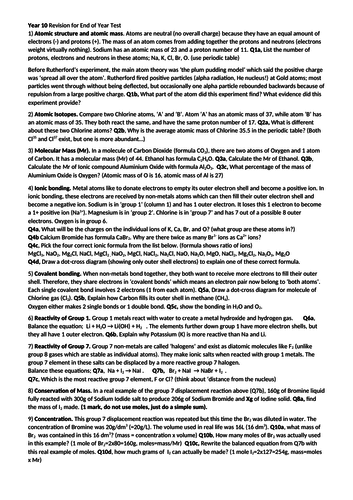
This lesson was designed based on current specifications from AQA GCSE chemistry.
It is very effective to ask pupils to count the stairs on one side of the school before the lesson, and collect their varied results.
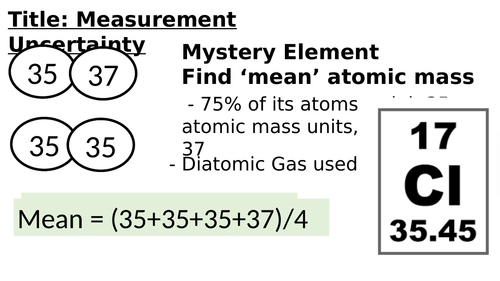
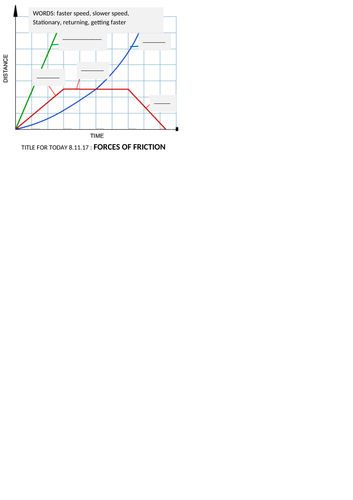
Here are two versions of powerpoints for lessons on Concentration.
The examples will introduce pupils to calculating concentrations in both grams per Litre and Moles per Litre (litre same as 1000cm3, 1000ml, or 1dm3, exam spec prefers 1dm3, good practise for A Level KS5)
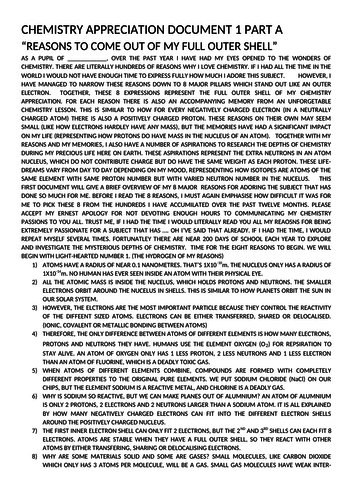
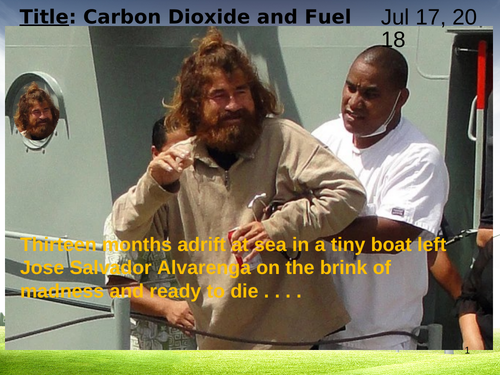
This is a useful document. Once one pupil has experienced been asked to write out several lines of this, the whole class will be eager to avoid being asked to do so. It is humerus and also includes many references to scientific content from GCSE curriculum such as atomic structure.
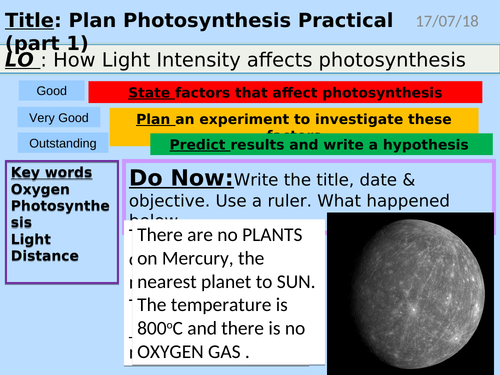
These resources were used to guide year 9 pupils through this Key Stage 4 Required Practical.
The experiment does not always work properly (in regards to approximating the intensity of the bubbles produced). Therefore, a sensible results table has been prepared, to share with the students.
Activities for the students were;
-design sensible experiment method
-revise different types of variables
identify the inverse relationship between Light intensity and distance of lamp from the plant.
correct the crossed-out data in table
calculate averages of number of bubbles, use correct units.
Make graph with correct X axis (light intensity or distance) and Y Axis (dependent, bubbles)
analyse graph, is there correlation?
explain graph, what is happening to cause bubbles?
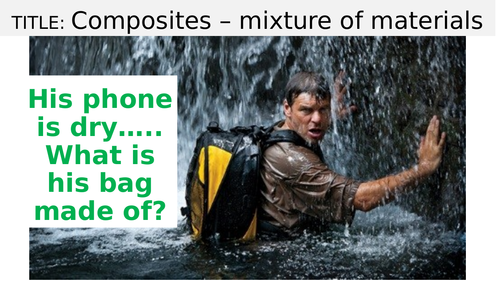
This lesson has been used on several key stage 3 classes.
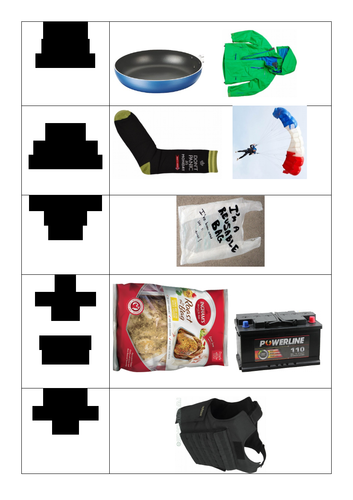
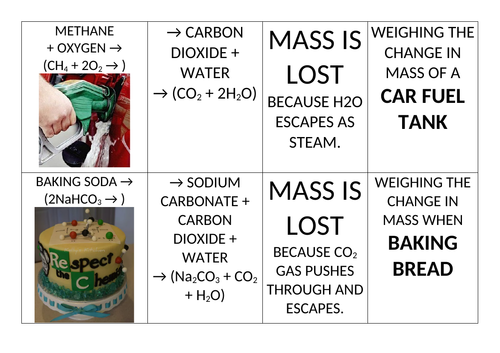
There is a card game which I made. It is mixed up. Pupils can do the cutting and sticking to match up the substances to the picture.
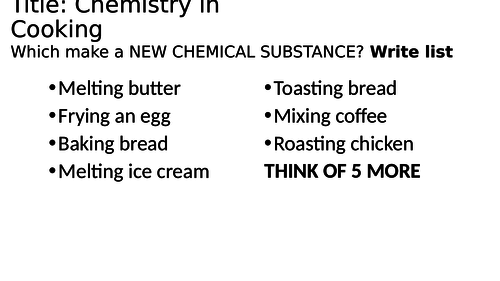
This resource is a good introduction to the differences between physical and chemical changes for Key Stage 3 pupils. It goes well with some live examples, such as frying an egg or toasting bread.