 Quick View
KS3 Sankey diagrams - reading and drawing
Sankey diagram worksheet for KS3/4.
Task 1: is calculating efficiency from reading sankey diagrams, also includes a final task of ‘Spot the error’.
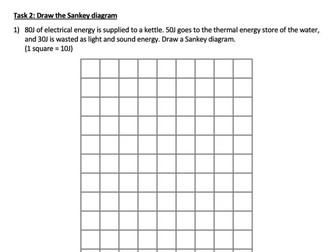
Task 2: is drawing 2 sankey diagrams to scale.
Quick View Quick View
 Quick View
 Quick View
 Quick View
 Quick View
 Quick View
 Quick View
 Quick View
 Quick View
 Quick View
 Quick View
 Quick View