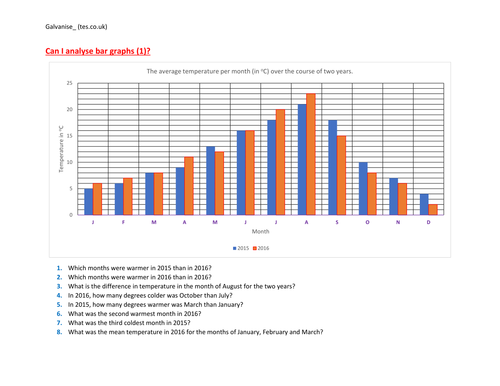


A two-way differentiated activity sheet/worksheet that will develop the children’s understanding of bar graphs, data handling, averages and data handling vocabulary.
Sheet 1 - 8 Questions asking about the warmest/coldest months, difference in temperature between months. There are two data sets on the graph (two lines, same axes)
Sheet 2 - 8 Questions focusing more on averages and trends. There are three data sets on the same axes. Completely different questions.
Answers are provided for both sheets. I have provided two different layouts which also add to the challenge. One has a wider line graph set, the other has a narrower set. This will test children’s adaptability to varying presentations.
Something went wrong, please try again later.
This resource hasn't been reviewed yet
To ensure quality for our reviews, only customers who have purchased this resource can review it
Report this resourceto let us know if it violates our terms and conditions.
Our customer service team will review your report and will be in touch.