

These are excel spreadsheet Gap Analysis documents for the May 2016 Year Six SATs Papers for Reading, Mathematics (Arithmetic, Reasoning 1 & 2), GPS and Spelling Papers. The sheet totals up the scores automatically and each child’s final score changes colour to reflect their ability.
If their total score for a subject goes green, it means they would have passed the 2016 SATs with that score. If it goes Orange, it means they are within touching distance. If it goes Green with a yellow font, it means that child would have achieved a ‘More Able’ score for that tested subject.
There are three spreadsheet documents. One for Reading, one for Maths, and one for GPS. They are broken down into individual papers inside.
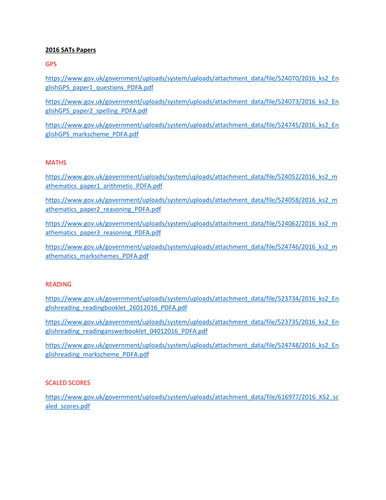
I have also included a digital document, linking to a freely available copy of each test, mark scheme and instructions. Additionally, I have included the conversion tables from RAW Score to Scaled Score.
All a teacher has to do is enter their children’s names and enter the 0’s, 1’s, 2’s or 3’s for each question, which also change colour too for a visual reference. I recommend that a teacher should enter ‘N’ if a child did not attempt that question. This gives an idea of who is not even attempting certain questions, not just whether they got the question wrong.
Last academic year I used these grids to provide targeted feedback and to spot trends. As a result my class were well over National Average for all subjects (much to my relief!)
I take requests for Gap Analysis Grids. Please leave feedback if you like this resource as I am planning to produce more for each SATs paper going forward, as well as CGP Practice Papers.
Please remember to rate this resource as I made this to save teachers time. Thank-you.
Something went wrong, please try again later.
Report this resourceto let us know if it violates our terms and conditions.
Our customer service team will review your report and will be in touch.