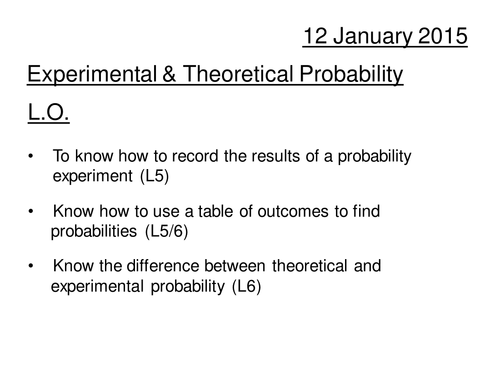

A Powerpoint and Excel file which describe a coin-tossing probability experiment (what is the probability of getting 2 Heads when you toss a coin three times?) Paired activity - experiment is described on the slides and a recording sheet is provided. When the time is up, teacher asks each pair to give their results, which are typed directly into the spreadsheet. A dynamic, real-time bar graph is generated, with each entry.
Follow up with investigation of how you arrive at theoretical probability by generating a table of outcomes for the coin-tossing task. Finally, discussion of differences between the two results, and how the experimental probability would likely alter if we increase the number of coin-tosses. Please leave feedback comment/rate, if you like this resource, or have any suggestions for improvement.
Thank you
Dave Wilson
Something went wrong, please try again later.
Thanks
Thanks for posting this resource, my year 7 and 8 students enjoyed working with this resource and consolidated their understanding and knowledge of probability. Excellent group activity. Had extension involving creating a sample space diagram using 2 dice
Report this resourceto let us know if it violates our terms and conditions.
Our customer service team will review your report and will be in touch.
£0.00
