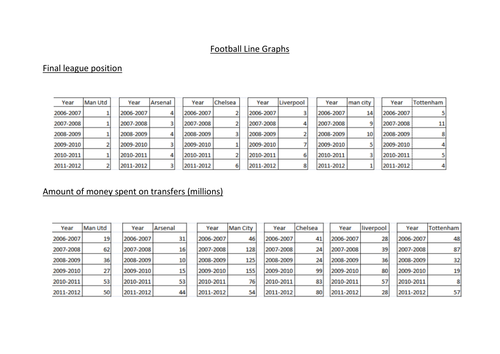
This has data of the 'top six&' teams in the premier league and their end of season league positions and the amount of money they spent of transfers that season. The aim being for students to plot two line graphs and draw inferences.
Another sheet for strikers with appearances, goals and goal ratio to draw similar inferences.
Something went wrong, please try again later.
This is a nice context-based resource to use when studying line graphs, students have to draw and interpret several line graphs (axes are not given). I can imagine students being engaged by this. Thank you for sharing.
Report this resourceto let us know if it violates our terms and conditions.
Our customer service team will review your report and will be in touch.
£0.00
