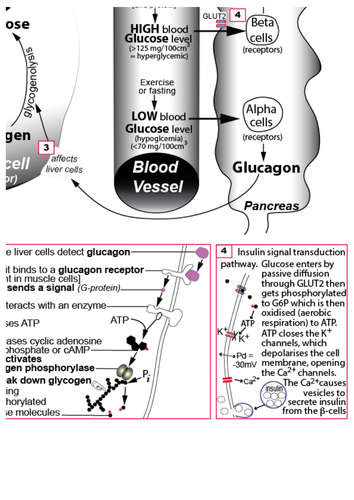


A diagram showing relationships between:
glucose in muscle cells, liver cells, fat cells and blood plasma
glucose, glycogen and triglycerides
insulin and glucagon
glycogen synthetase and glycogen phosphorylase and cAMP
GLUT2 and GLUT4 transporter proteins
Use: Revision or Teaching aid
Level: Suit CIE A Level Topic 14 Homeostasis
First page shows part of Diagram
Something went wrong, please try again later.
This resource hasn't been reviewed yet
To ensure quality for our reviews, only customers who have purchased this resource can review it
Report this resourceto let us know if it violates our terms and conditions.
Our customer service team will review your report and will be in touch.
£2.00