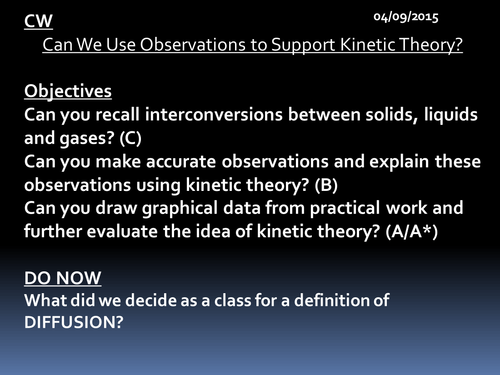
Second lesson from section 1, topic a. PowerPoint includes starter, theory, practical and plenary. Expects students to be able to describe the properties of solids liquids and gases and conduct experiment to collect data and draw a graph to show a cooling curve.
Objectives:
Can you recall interconversions between solids, liquids and gases? (C)
Can you make accurate observations and explain these observations using kinetic theory? (B)
Can you draw graphical data from practical work and further evaluate the idea of kinetic theory? (A/A*)
Objectives:
Can you recall interconversions between solids, liquids and gases? (C)
Can you make accurate observations and explain these observations using kinetic theory? (B)
Can you draw graphical data from practical work and further evaluate the idea of kinetic theory? (A/A*)
Something went wrong, please try again later.
This resource hasn't been reviewed yet
To ensure quality for our reviews, only customers who have purchased this resource can review it
Report this resourceto let us know if it violates our terms and conditions.
Our customer service team will review your report and will be in touch.
£1.00
