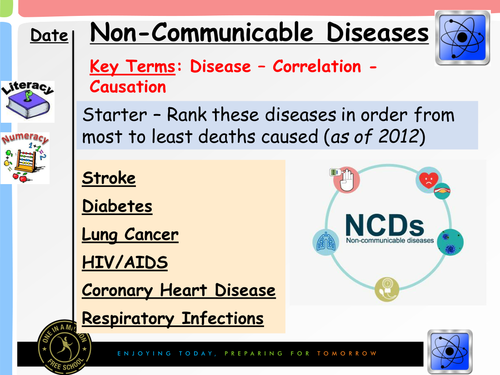

Lesson plan investigating non-communicable diseases and correlation v causation. Instructions and ideas for delivery are included in the notes section. I used post-it notes within the lesson for a group task, but the lesson can be delivered without.
Starter - Students rank diseases in order from most to least deaths caused as of 2012 before identifying risk factors relating to these.
Main 1 - Continuum of risk factors for students to rank from least impact on health to most impact. Post it notes were used for groups of students to rank their own ideas before feeding back as a class. This then leads into a table activity whereby students identify diseases as communicable or non communicable.
Main 2 - Worked class example of correlation vs causation using pollen, ice cream and hay fever as a way of introducing the idea. Students grasp that evidence is needed to imply causation through correlation, and some ridiculous examples are used to highlight this idea before students explain evidence for 3 non communicable diseases. Feeds into a data worksheet task on link between liver disease and alcohol consumption.
Plenary - Students come up with 5 ideas on how to minimise the risk of developing one of the non communicable diseases covered in the lesson.
Objectives:
GOOD – LIST some risk factors that are linked to an increased rate of a disease.
GREAT – DECIDE whether a link is causal or not.
EPIC – DRAW conclusions on disease from given data
As always any feedback is appreciated :)
Something went wrong, please try again later.
Exactly what I was looking for.
Report this resourceto let us know if it violates our terms and conditions.
Our customer service team will review your report and will be in touch.
£3.00
