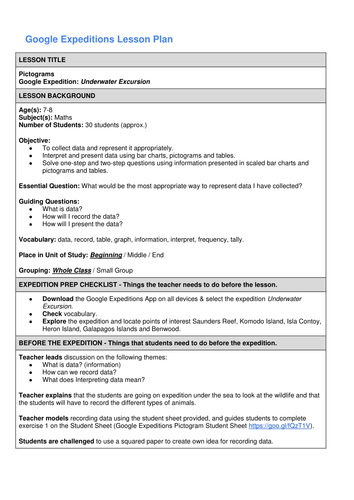


This #GoogleExpeditions lesson develops student skills in data representation and the use of pictograms.
Students start by using pictograms to represent the amount of fruit they have eaten and will eat. They then take a trip through a series of underwater vistas, recording the frequency of different types of sea creatures. They then apply their knowledge of data representation to create frequency pictograms.
Google Expeditions are immersive 360 degree photo stories designed for use in the classroom. For more see: https://www.google.com/edu/expeditions/
To download Google Docs versions of the lesson plan and student sheet go to: https://goo.gl/6v0jau
Something went wrong, please try again later.
This resource hasn't been reviewed yet
To ensure quality for our reviews, only customers who have downloaded this resource can review it
Report this resourceto let us know if it violates our terms and conditions.
Our customer service team will review your report and will be in touch.