

When doing pie charts I like to start with just giving the students tables of angles to draw correctly on a pie chart. This allows me to assess their confidence with using a protractor correctly (I always overestimate how comfortable students are with protractors) and also helps me to deal with the usual misconceptions of drawing a pie chart (I will often take a photo of the mistakes on my phone and display them on the board). Once we have discussed these misconceptions students are usually fine with drawing a pie chart after this activity, so I don’t get the students to draw another pie chart for the rest of the lesson (unless they have finished quickly). The fourth pie chart being blank is for students to design their own table and angles - this is a great time for students to realise that the sum of the angles must be 360 degrees.
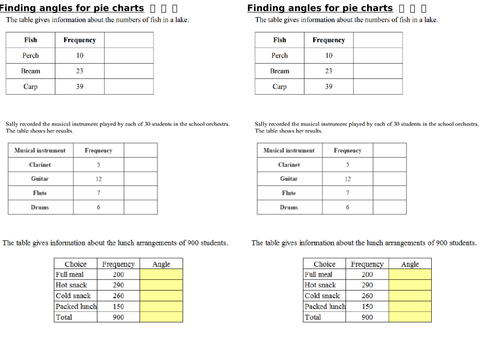
I then move on to calculating angles from a frequency table, but as I know students can draw pie charts we just focus on getting the angles correctly.
I will then get students to talk about the pros and cons of pie charts and usually end with some questions like the famous “Germany and Russia gold medals” exam question.
I will sometimes then give them a table with three groups - one containing 14 people, the second containing 8 and the third containing 5 and ask them what problems this would pose if we wanted to draw the pie chart for this table with a protractor.
Something went wrong, please try again later.
Report this resourceto let us know if it violates our terms and conditions.
Our customer service team will review your report and will be in touch.
£0.00