36Uploads
24k+Views
2k+Downloads
Math

AP Calculus Memorization Packet
AP Calculus Memorization Packet has tables, graphs, definitions, explanations, and examples for just about every topic covered on the AP Calculus AB test. This study guide is always being updated and organized to be more clear and to help students. A general understanding of the topics and concepts is necessary for this study guide to be of use. A lot of information is packed into six pages, organized by topics. The topics include: derivatives, applications of derivatives, integrals, application of integrals, limits, and parent functions.

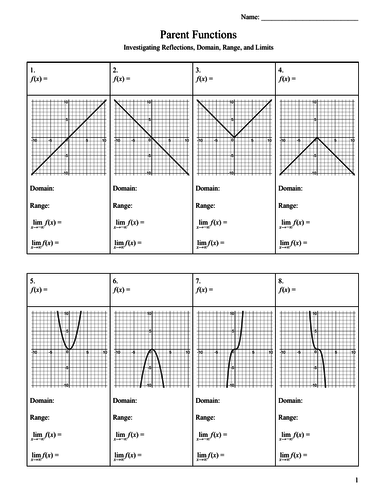
Parent Functions - Reflections Domain Range Limits
This package includes 40 functions to help students understand and make connections between the reflections of parent functions, and the resulting changes in domain, range, and end behavior. This activity is great for students to work collaboratively and to discuss the connections in math with one another. It a great review of precalculus before students begin calculus.
As a teacher there are three options:
You can give your students a graph of a function and they must fill in the equation, the domain and range, and the end behavior.
You can give your students an equation of a function and they must sketch a graph, and give the domain and range, and the end behavior.
You can give your students the answer key as a resource for them to keep and refer back to throughout the year.
This activity will allow students to gain a better understand of x-intercepts, y-intercepts, domain, range, asymptotes, increasing and decreasing intervals, maximum and minimum values, symmetry, vertical and horizontal reflections, and limits.
This package covers the following parent functions.
Linear Function
Absolute Value Function
Quadratic Function
Cubic Function
Square Root Function
Cube Root Function
Rational Function
Exponential Function
Logarithmic Function
10 Trigonometric Functions (sin/cos/tan/cot/sec/csc)
Constant Function
Greatest Integer Function

IB Math SL TI-Nspire Statistics & Probability Calculator Guide
This guide is helpful for students and teachers in International Baccalaureate Math Standard Level. This 6 page document covers three main topics: Statistics, Binomial Distribution, and Normal Distribution. The guide instructs students on what buttons to press and what each of the features will do. From adding spreadsheets, analyzing a set of data, finding the linear regression, using the binomial pdf and cdf features, and using the normal pdf and cdf and inverse Norm features, this guide is a create tool to summarize what the students need to know for the calculator portion of the IB Math SL test.
There are a few short examples (with answers provided) for students to test their understanding of the calculator features.

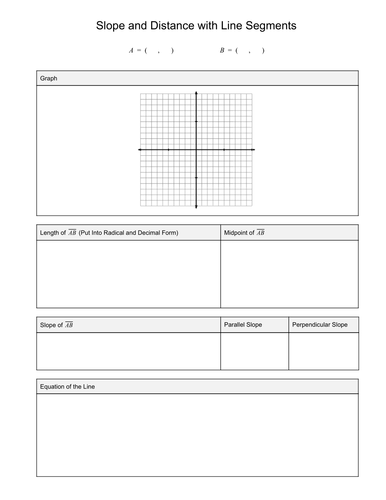
Geometry Link Sheet Package (8 Full Page Templates)
This package includes 8 link sheets that will help students understand and make connections between triangles and quadrilaterals and how to transform and classify them.
Once the teacher gives students coordinate points for a specific template, the students will complete the graphs and understanding questions on the remainder of the link sheet. This activity is great for students to work collaboratively and share and discuss the connections in math with one another.
These activities will allow students to gain a better understanding of slope, midpoints, distance between points, linear equations, transformed coordinates, perimeter, and area. This package include link sheets that cover the following topics:
1) Slope and Distance with Line Segments
2) Transformation of Triangles
3) Transformation of Quadrilaterals
4) Multiple Transformation of Triangles
5) Classifying Triangles
6) Classifying Quadrilaterals
7) Transformation and Classifying Triangles
8) Transformation and Classifying Quadrilaterals
*Also includes "Shape Reference Sheet" to help your students in classifying the triangles and quadrilaterals

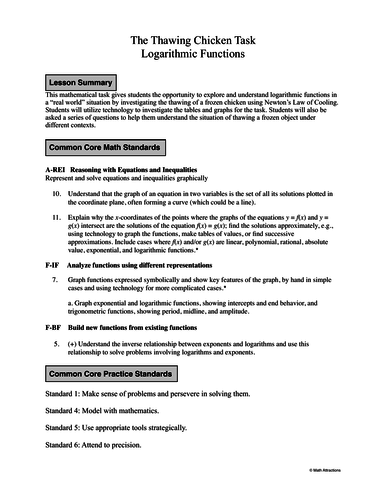
The Thawing Chicken Task - Logarithmic Functions
Engage your students in a mathematical task investigating the thawing of a frozen chicken using Newton’s Law of Cooling. This mathematical task gives students the opportunity to explore and understand logarithmic functions in a “real world” situation by investigating the thawing of a frozen chicken using Newton’s Law of Cooling. Students will utilize technology to investigate the tables and graphs for the task. Students will also be asked a series of questions to help them understand the situation of thawing a frozen object under different contexts.
This activity requires a basic understanding of logarithmic equations, and a strong background of manipulating algebraic equations and with graphing equations using technology.
This pdf file includes 2 title pages, a 7 page activity with graphs, tables, and space for students to write their work, and a 7 page answer key of the entire activity.

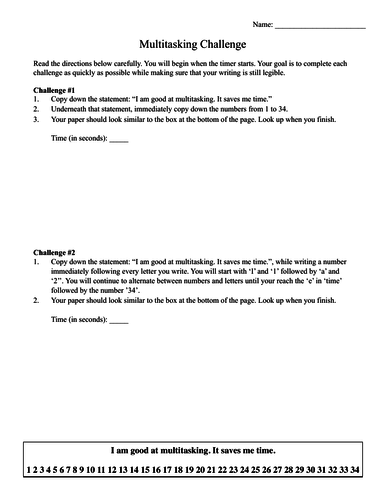
Multitasking Challenge - Box Plot Activity
Do you students ever say that they are good multitaskers? Use this activity to show them that their typical perception of multitasking is actually an act of “task switching” and is a hindrance to learning. By using one class timer, each student will discover how long it takes them to complete two separate writing challenges. After the challenges are complete, you can use this data to have students find the five number summary in order to create and compare box plots of the challenge times. This activity can lead to a great class discussion that can encourage students to avoid distractions when they are doing school work.

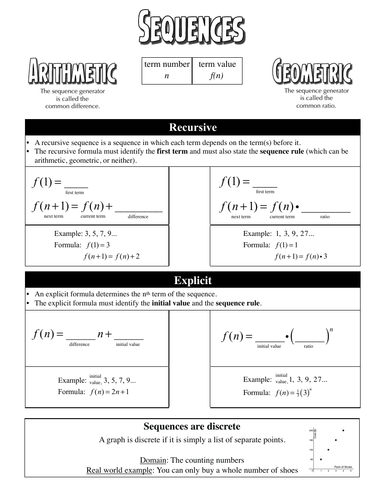
Math Guide - Sequences and Functions
A math guide that helps students with vocabulary such as sequences, arithmetic, geometric, term number, term value, sequence generator, common difference, common ratio, recursive formula, explicit equation, initial value, discrete, continuous, linear, exponential, increasing, decreasing, simple interest, compound interest, population growth, radioactive decay, appreciation, depreciation. This math guide also provides comparisons between sequences and functions.

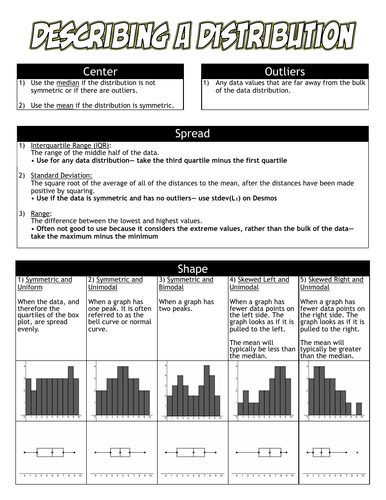
Math Guide- Describing A Distribution
A math guide that helps students with vocabulary such as center, outliers, spread, shape, median, mean, distribution, symmetric, outliers, interquartile range, standard deviation, range, uniform, unimodal, and bimodal. This math guide also provides visuals to help students understand two-way tables, relative frequency two way tables, Desmos statistic features, and box-plots.

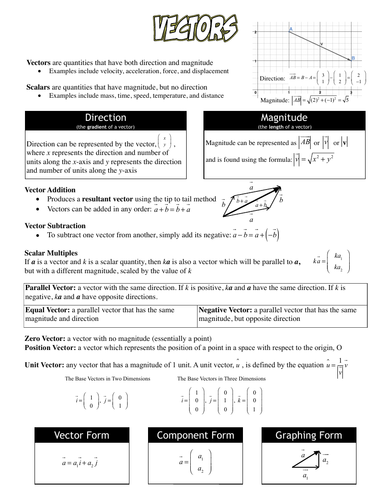
Math Guide - Vectors
A math guide that helps students with vocabulary such as vectors, scalars, direction, magnitude, vector addition, vector subtraction, tip to tail method, resultant vector, scalar multiples, parallel vectors, equal vectors, negative vectors, zero vectors, position vectors, unit vectors, base vectors in two dimensions, base vectors in three dimensions, vector form, component form, graphing form, vector equation, parametric, Cartesian, resultant, dot product, scalar product, angle between two vectors, orthogonal, coplanar and skew.
This math guide is designed to help students in International Baccalaureate (IB) Standard Level Math.

IB Math SL GeoGebra Vectors Activity
This lesson helps students understand the basics of vectors, including topics such as magnitude, parallel vectors, component and vector forms, unit vectors, and the dot product. Students will also gain familiarity with GeoGebra and technology during the process.
Pairs great with Math Guide - Vectors

Calculus The Fundamental Theorem of Calculus (Visualization Guide)
This calculus study guide will helps students differentiate between the height of a function, the average height of the function, the slope of a tangent line, the slope of a secant line, the area under a curve, and the change in height between two points. Students will compare these six characteristics of a function using an original function as well as its antiderivative function.
There are 16 total problems where students can conceptually draw in the visuals themselves. An answer key is included as well.

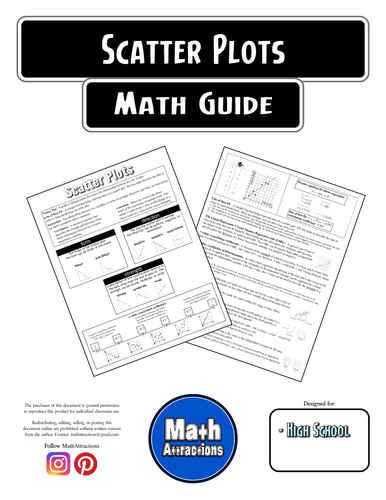
Math Guide - Scatter Plots
A math guide that helps students with vocabulary such as scatter plot, line of best fit, causation, correlation, association, strength, direction, form, outliers, least squares regression line, LSRL, correlation coefficient, r-value, coefficient of determination, extrapolation, and residual. This math guide also provides visuals to help students determine whether a line of best fit is strong, moderate, or weak.

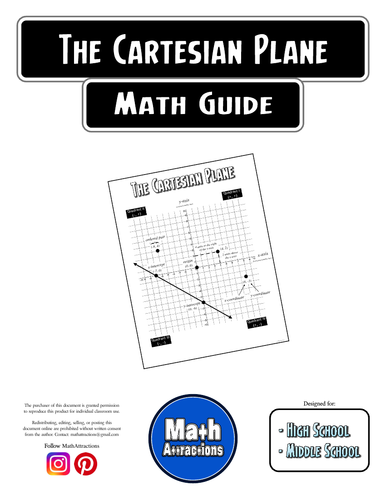
Math Guide - The Cartesian Plane
A math guide that helps students with topics such as the x-axis, the y-axis, horizontal, vertical, quadrants, origin, ordered pairs, coordinates, and intercepts

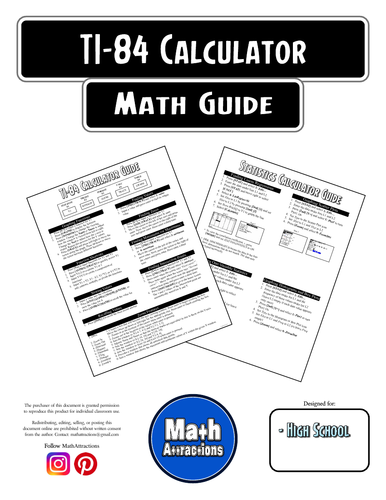
Math Guide - TI-84 Calculator Guide
A math guide specifically designed for the TI-84, TI-84 Plus, and TI-84 Plus CE calculators. This guide provides instructions for graphing and evaluating functions, using shortcuts with functions, finding zeros, finding maximums and minimums, finding intersections, and using zoom features. The second page of the guide is designated to providing instructions for linear regressions and statistical information, graphing scatter plots, and graphing histograms and box plots.

Algebra 1 "Reusable Dry Erase Pocket" Template Guides
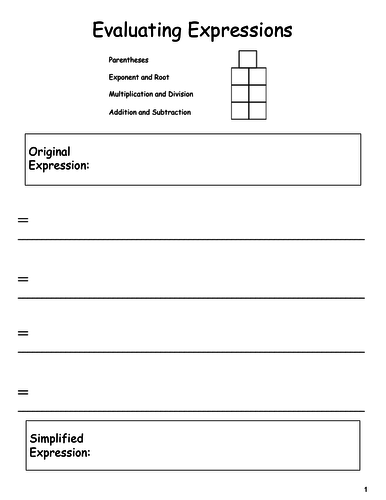
These Algebra 1 graphic organizer guides are designed to slide inside reusable dry erase pockets. Simply give students an expression, an equation, a function, a system, or some coordinate points, and students will complete the template guide to organize their thought process and properly communicate mathematics. These guides cover many of the major topics from Algebra 1.
The 26 templates include:
Evaluating Expressions
Solving Equations
Function Machine
Describing Graphs
Domain and Range
Linear Equation from Two Points
Simplifying Exponents
Multiplying Binomials
Absolute Value Equations
Solving Literal Equations
Substitution Method
Elimination Method
Systems Word Problems
Factor Table
Sequences (Recursive Formulas and Explicit Equations)
Sequence Formula
Scatter Plots
Two Way Table
Linear Equation from Two Points
Linear vs Exponential Functions
Factoring
Graphing Quadratics
Completing the Square
The Quadratic Formulas
One Variable Inequalities
Two Variable Inequalities


