All my resources have been created to use with classes I teach. Often I've created resources because, for a particular topic, I haven't been happy with the number/standard of the examples in a textbook. Sometimes I've created worksheets for certain topics (e.g. graph transformations) because I feel my classes will make greater progress on a printed worksheet than trying to work from a textbook. I always aim to produce high-quality resources that improve the students' learning and understanding.
All my resources have been created to use with classes I teach. Often I've created resources because, for a particular topic, I haven't been happy with the number/standard of the examples in a textbook. Sometimes I've created worksheets for certain topics (e.g. graph transformations) because I feel my classes will make greater progress on a printed worksheet than trying to work from a textbook. I always aim to produce high-quality resources that improve the students' learning and understanding.
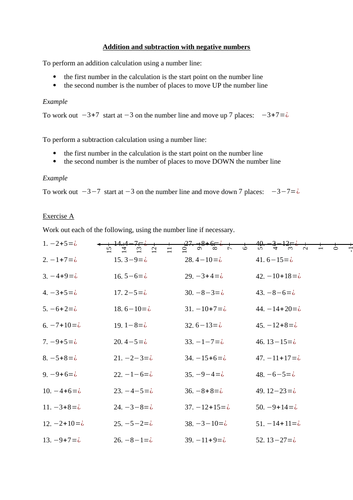
My year 7 class struggled to learn the rules for doing calculations that involved negative numbers so I created these resources to try to help them understand the rules and to give them lots of practice.
The first resource focuses on addition and subtraction, with explanations of how the calculations can be understood with reference to a number line, and then exercises with lots of practice (over 150 questions).
The second resource focuses on multiplication and division, with a page dedicated to them just practising determining whether the answer of a calculation should be positive or negative, and then an exercise with lots of practice calculations (over 80 questions).
The third resource contains mixed questions with all 4 operations (over 60 questions).
Answers to all the questions are included.
The final resource is a spreadsheet where pupils can practise calculations and get instant feedback on their accuracy. Note that the spreadsheet contains macros so when opening the file users may need to click on “Enable editing” or “Enable macros” for it to function correctly.
In each question the students are given two different shapes and told the relationship between their perimeters/area/volumes. Based on this information they must either work out a length of one of the shapes or express a length of one shape in terms of a length of the other.
These can be demanding questions and, in my experience, students struggle with these questions unless they've had a fair bit of practice.
This worksheet contains 6 pages of questions and all answers are provided.
This worksheet has 10 pages of questions for students to practise finding the shaded area between two shapes (2D) or the difference between the volume of two shapes (3D).
There is a mixture of calculator and non-calculator questions, which is clearly indicated.
All answers are provided at the end of the worksheet.
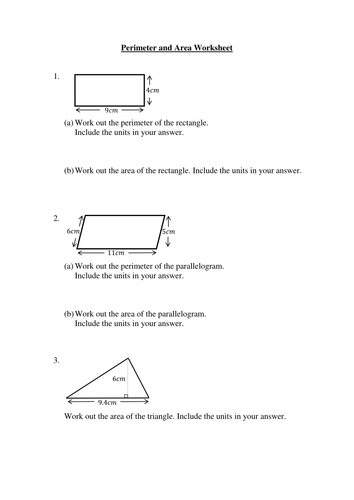
A worksheet with 6 pages of questions of increasing difficulty on the topic of area and perimeter just using rectangles, triangles, compound shapes and trapezia.
It includes questions where the area of perimeter is given and an unknown length must be found.
All answers are provided.
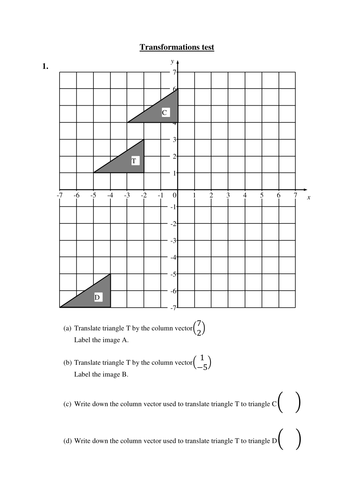
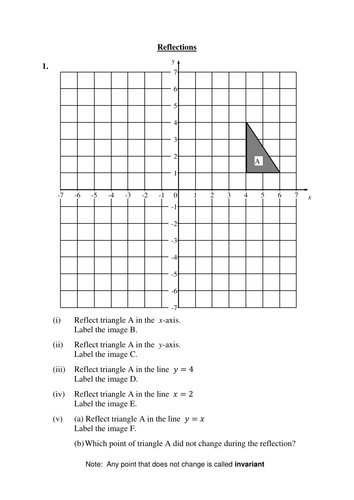
These printable worksheets make it easier to teach this topic as the questions and solutions can just be projected onto a board or screen to work through or check as a class.
These are suitable for the new GCSE spec and include questions on invariant points.
I normally work through the first worksheet as an example and then set the second worksheet as a task for the class to do on their own.
Solutions included.
These resources are designed to get students to practise using all 3 methods for solving quadratic equations and then to use their solutions to add information onto a given sketch.
The first resources contains examples that are intended to be worked through as a class (no answers provided).
The second resource is 4-page worksheet for students to work through on their own (worked solutions provided).
These resources can be used to introduce how the efficiency of algorithms can be compared and measured.
In the first worksheet there is an example comparing bubble sort and shuttle sort, an example finding the order of an algorithm and then some examples using the order of an algorithm to estimate the time it will take to solve a problem of a particular size (fully-worked solutions are provided).
In the second worksheet there are 12 exam-style questions on using the order of an algorithm to estimate the time it will take to solve a problem of a particular size. There is also the excel spreadsheet I created to generate examples - this can used to make as many more examples as you want.
After a few years of teaching sorting algorithms by creating and working through examples on the board I got sick of it and created these resources. They make it easy to introduce, work through some examples and then there is another worksheet full of examples for students to attempt where the fully-worked solutions are already done, making it easy to check. The printable worksheets mean that students don't need to copy down lists of numbers or create tables to work on - this means they can spend the time just practising using the algorithm.
There is also the excel spreadsheet I created to generate examples - this can used to make as many more examples as you want (instructions are on the spreadsheet).
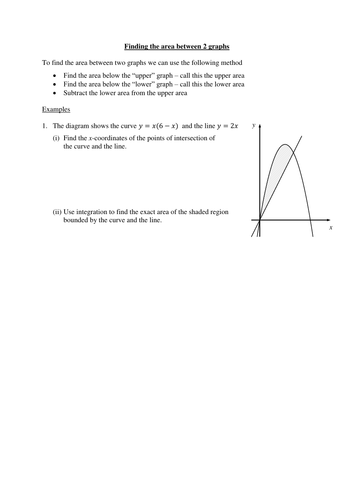
This worksheet has 4 pages of questions, each with a diagram, for your students to practise finding the area between two graphs. The first 4 questions are on areas between a curve and a line, the remaining questions are on areas between 2 curves. Answers to all questions are provided.
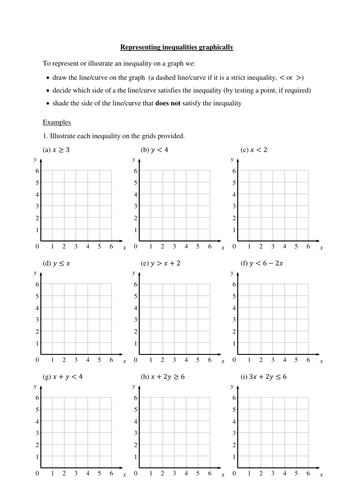
This 4-page worksheet will give your students plenty of practice at representing linear and quadratic inequalities on graphs, as well as writing down the inequalities illustrated by given regions.
This printable resource will make it much easier for your classes to work through this topic rather than working from a textbook or drawing axes/diagrams themselves.
There are over 30 questions on the worksheet - solutions are provided.
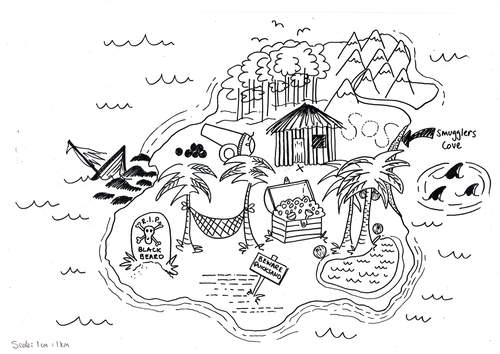
This is a desert-island themed activity where students must follow instructions involving bearings and using the scale of the map to find where Mr.Crusoe visits each day.
All my classes have loved this activity (and have enjoyed colouring in the map afterwards!).
Make sure the map is printed as A3 size or the scale will not be correct!
This worksheet is designed to develop students' knowledge and confidence when expanding and simplifying expressions that involve two brackets.
The worksheet includes questions ranging from 2(3x+4) - 5(x-3), then (x+4)(x+2), (x-3)^2, and up to (2x+1)(x-4).
The solutions are fully worked solutions showing each step of the expansion and simplification.
This worksheet is designed to help students practise writing or understanding descriptions of graph transformations.
There are 2 types of questions on the worksheet. In the first they are given the equation of the original graph and the equation of the transformed graph - they must a correct description of the transformation. In the second type they are given the equation of the original graph and the description of the transformation - they must write down the correct equation of the transformed graph.
There are 20 questions of each type. All answers are included.
Please note this is designed for the new GCSE spec so only covers translations and reflections.
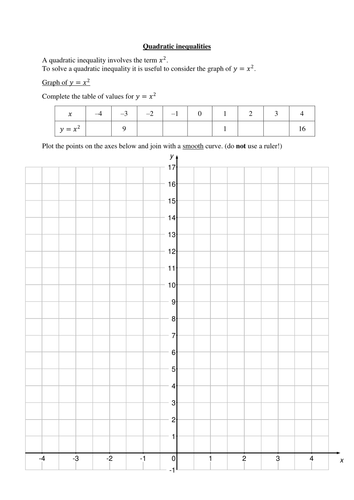
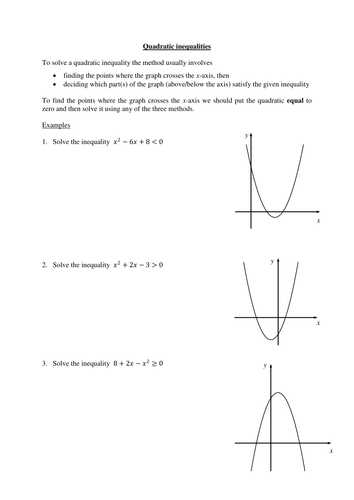
This 4-page worksheet introduces the method for solving quadratic inequalities of the form x^2k.
After explaining the method there is a short exercise to practise solving inequalities of the form x^2k.
There are then some examples that require simplification or rearranging to solve (e.g. 3x^2-75>0) to work through as a class, followed by an exercise of similar questions for students to attempt.
All answers are included.
This worksheet contains over 20 questions for students to practise solving 3-term quadratic inequalities.
For the first handful of questions a sketch of the quadratic graph is provided as an aid.
The questions become increasingly difficult and this worksheet will be a good challenge for able GCSE pupils who know the methods for solving quadratic equations.
All answers are included at the end of the worksheet.
If one shape is placed inside another a common question is "what fraction of the larger shape is taken up by the smaller shape inside it?".
In my experience students struggle with this type of question unless they've had a fair bit of practise.
This worksheet has a mixture of 2D/3D questions on this topic, with all answers provided.
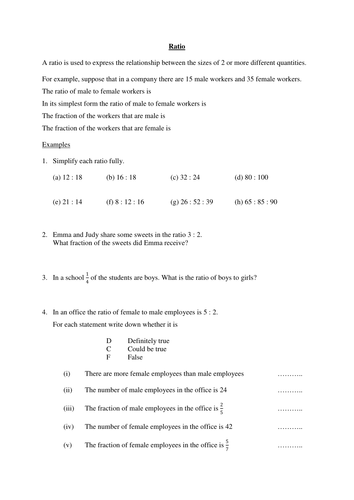
The introductory sheet looks at the three different types of ratio questions. For each type there are examples intended to work through as a class then there are additional questions for students to attempt on their own (answers provided).
The second resource contains 12 exam-style questions (answers included).
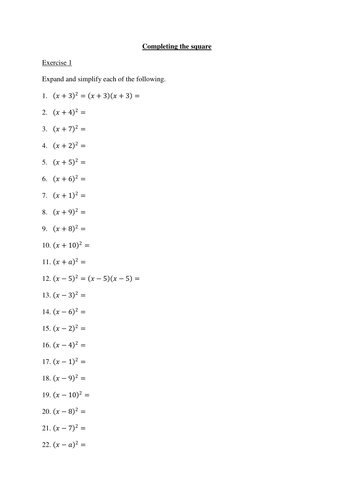
I have used this 4-page worksheet with my classes to get them to understand the process of completing the square on expressions of the form x^2+ax+b.
The worksheet takes them through the following stages:
1. Practise expanding and simplifying (x+p)^2
2. Practise expanding and simplifying (x+p)^2+q
3. Practise writing x^2+ax+b in the form (x+p)^2+q
My classes have usually had a good understanding of how completing the square works after finishing this worksheet and are ready to practise using it to solve quadratic equations.
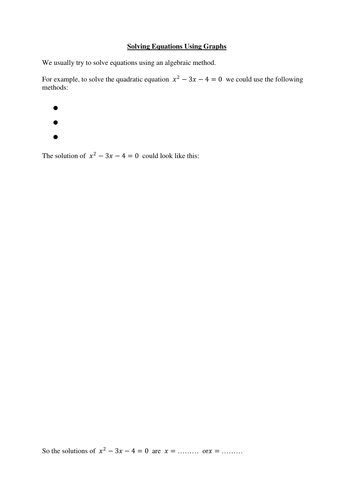
My classes have often found this a tricky topic and I found it difficult to explain it well and give them sufficient examples with work on the whiteboard and a textbook.
The first worksheet has made me more confident when teaching this topic and certainly contains plenty of examples (12) to help students understand the methods used to answer these questions.
The second worksheet is just some additional practice of the rearranging of equations which is often required when using a given graph to solve an equation.
Solutions to both worksheets are included.