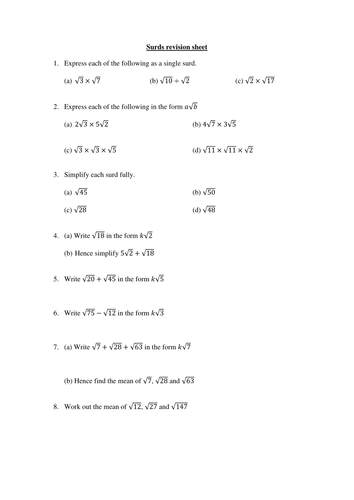
All my resources have been created to use with classes I teach. Often I've created resources because, for a particular topic, I haven't been happy with the number/standard of the examples in a textbook. Sometimes I've created worksheets for certain topics (e.g. graph transformations) because I feel my classes will make greater progress on a printed worksheet than trying to work from a textbook. I always aim to produce high-quality resources that improve the students' learning and understanding.
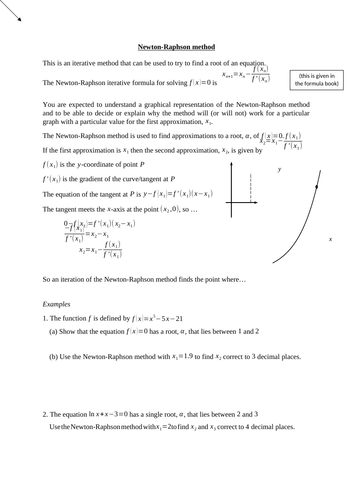
The presentation and accompanying worksheet introduces the topic of differentiation by considering the gradients of progressively smaller chords that are used to estimate the gradient of the curve/tangent at the point. Students use this method to find the gradient at some points on the y=x^2 curve and then on the y=x^3 curve - from these results they should be able to guess at generalising the method for differentiating x^n and then ax^n. This presentation and worksheet take a while to work through so this may take up a whole lesson.
The worksheet starts by reminding students how to differentiate and what dy/dx represents. In section A there are 18 examples of finding dy/dx to work through as a class, and then 30 questions for students to complete on their own. In section B there are a few examples of finding the gradient of a curve at a given point (to do as a class), then 10 questions for students to complete on their own. All answers are provided for the students' questions.
Note that this resource was designed specifically for the Level 2 Further Maths qualification, so only covers differentiating functions with positive integer powers such as y=5x^3-4x+2, but can still be used an introduction to differentiation in general.
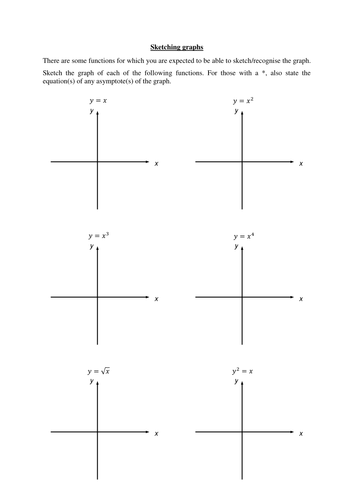
The first two resources are 2 different worksheets that can be used to get your class to learn the different types of graph they are expected to be familiar with at GCSE (linear, quadratic, cubic, reciprocal, exponential and square root) and to be able to recognise or sketch them.
The first resource gets them to calculate points, plot them and join them up, while the second resource was designed to use Geogebra, but would suit any graphing software. In my experience students need a fair bit of time to complete these so this activity may well fill your entire lesson.
The third resource is a worksheet to check their knowledge after completing one of the earlier activities (solutions included).
This resource is a great way to cover this whole topic using prepared notes and examples to explain it to your students. Projecting the notes/examples will save you a lot of work on the board and your students will save time by working on the provided spaces and axes when doing sketches. You could also email/print some or all of this for students who have missed lessons or need additional notes/practice/revision.
The sections cover the following:
1. Sketching graphs of the form y=mod(f(x)) e.g. y=mod(x-2)
2. Sketching simple transformations of y=mod(f(x)) e.g. y=mod(x)+4
3. Solving equations involving the modulus function. This covers the different types of equations and explains when a sketch may/must be used. e.g. mod(x-4)=6 vs 2x+3=mod(x-1)
4. Solving inequalities involving the modulus function. This covers the different types of inequalities and explains when a sketch may/must be used. e.g. mod(x-4)=mod(2x+1) vs 3x-1=4-mod(x)
There are almost 100 questions in total across the different exercises. Answers to all questions in the exercises are provided, including sketches.
Here is an example of one of my A level resources that is freely available:
https://www.tes.com/teaching-resource/differentiation-and-integration-with-exponential-and-trigonometric-functions-new-a-level-11981186
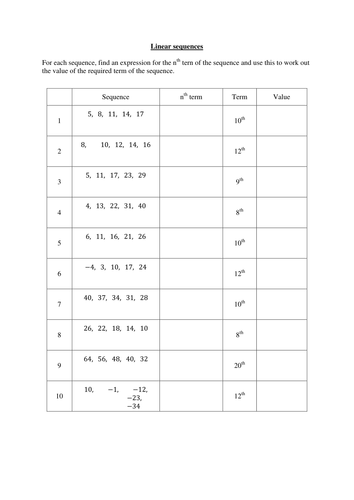
These worksheets are great to give your students practice of all the types of sequences they are expected to know about for the new GCSE.
Each sequence worksheet contains 20 questions. The questions include a mixture of finding the next term, finding an expression for the nth term, or finding the value of a given term later in the sequence. All worksheets come with solutions.
Also included is a 3-page worksheet that can be used to explain the method used to find the nth term of a quadratic sequence. This is a nice way for students to experiment to discover the relationship between the 2nd differences and the coefficient of n^2 and see how this forms the basis for finding an expression for the general term. Answers to the worksheet are included.
The final resource is designed to help students identify the type of sequence they are given. There are notes explaining the key properties of each type of sequence, with examples, and then there are 15 sequences for them to categorise and work out the next term. Answers are included.
There is approximately 2 hours worth of material here for an able GCSE group.
These worksheets can be used to introduce and practise the new GCSE topic of equation of a circle (centred at origin) and the equation of a tangent to a circle.
The first worksheet starts with an activity that helps the students to realise that x^2 + y^2 = k is the equation of a circle and is followed by some questions to practise using it.
The second document is an 8-page worksheet which can be used to revise all the necessary skills/knowledge required before studying the equation of a tangent to a circle. Working through this first seemed to really help my GCSE group with this topic. Answers are included.
The third document is a 9-page worksheet which focusses on finding the equation of a tangent to a given circle at a particular point or with a particular gradient. All answers are included.
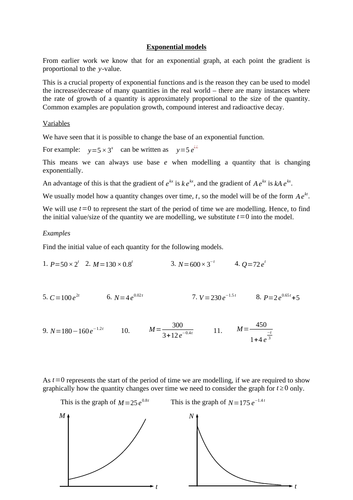
This resource is designed to help students understand the key properties of exponential models and to give them lots of practice of examination-style questions on the topic.
It begins by recalling the key properties of exponential graphs and introduces the form of the equation used in most exponential models.
The first section contains examples designed to help students realise that the same proportional change happens over equal time periods. There are a few examples that establish this property and then an exercise of questions for students to attempt.
The main section focuses on using exponential models and begins with 2 pages of example questions chosen to show students the typical style and demands of examination questions on this topic. There is then a 17-page exercise with almost 70 questions for students to attempt themselves. The exercise includes questions where students are required to explain the significance of parameters in models, the limitations of models, and to suggest possible improvements.
Answers to the exercises are included.
Here is an example of one of my A level resources that is freely available:
https://www.tes.com/teaching-resource/differentiation-and-integration-with-exponential-and-trigonometric-functions-new-a-level-11981186
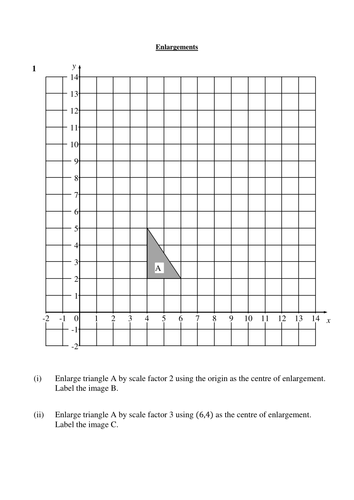
This set of resources includes everything you need to teach the graph transformations topic in the new A level. The printable resources will save you and your classes a lot of time which means there is more lesson time for them to practise and for you help develop their understanding.
As the topic requires knowledge of the properties of some graphs (e.g. asymptotes) the first resource can be used to see which graphs they can already sketch and to discuss the asymptotes of particular graphs.
The next resources are Geogebra files which can be used with the free Geogebra software. Each file can be used to discuss a particular type of graph transformation - there are sliders on each file that be changed or animated to see the initial graph transformed. This activity should help your class to visualise each type of transformation and start to get a feel for how the equation changes.
The notes and examples start with revising each type of graph transformation - giving some different ways the transformations can be described and what the transformation looks like using y=f(x) and with a particular curve. Once completed this is a useful revision resource and helps them complete the exercise of questions on the reverse which includes questions asking for the new equation of a transformed graph, or for a description of the transformation applied.
The final resource can be used to give your class practice of sketching transformations of y=f(x).
The answers to all questions are included, including the sketches.
Here is an example of one of my A level resources that is freely available:
https://www.tes.com/teaching-resource/differentiation-and-integration-with-exponential-and-trigonometric-functions-new-a-level-11981186
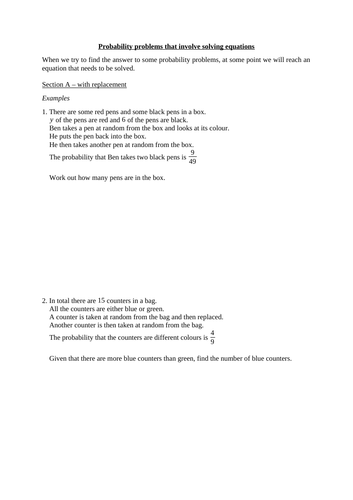
These resources deal with problems where 2 or more items are chosen at random, we are given the probability of a particular outcome, and this is used to derive a quadratic equation that then needs to be solved.
The first resource can be used to teach the topic. It is in two sections - section A deals with selection with replacement, section B deals with selection without replacement. In each section there are 2 examples to work through with the class, followed by an exercise with more than 10 questions of increasing difficulty for the class to attempt themselves. Fully worked solutions to the examples and exercises are included.
The second resource is another set of questions that can be used as a homework or revision - 8 questions that are a mixture of with/without replacement.
Also included is a spreadsheet that calculates the probabilities for all outcomes in situations where there are between 5 and 40 items - just in case your class loves this topic and wants more questions!
I think this is difficult topic to teach well from a textbook. I find these resources make it a lot easier to teach the topics and help my classes make greater progress in the lesson.
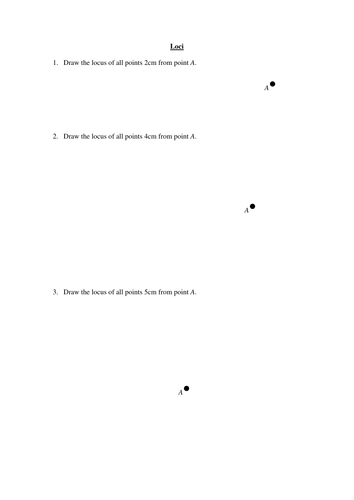
A practice worksheet for loci (8 pages, with solutions), then a practice worksheet on constructions (8 pages).
Then a mixed worksheet (8 pages, with solutions).
Note - make sure these worksheets are printed at full size (A4) or the scale/measurements will not work!
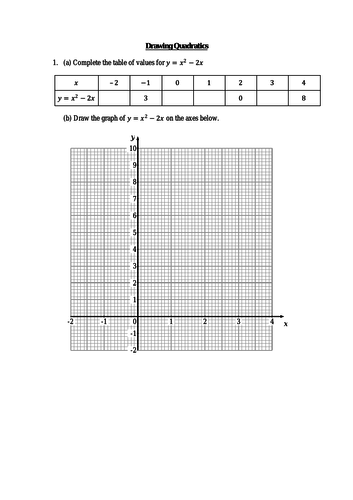
These printable resources are ideal for getting students to practise working out coordinates for quadratic functions and drawing their graphs. Partially completed tables and graph paper are provided for each question.
The first worksheet contains 10 questions all of the form y=x^2+ax+b.
The second worksheet contains 8 questions, some of the form y=x^2+ax+b and some are y=ax^2+bx+c where a>1. Some of these questions are harder that the first worksheet because there isn’t any “symmetry” within the y-values in the table, which serves as a check.
The homework contains 6 questions: 4 of the form y=x^2+ax+b, 2 of the form y=ax^2+bx+c where a>1.
All solutions are included to print or project for your class to check their tables and graphs.
A set of resources to teach and practise solving quadratic equations by factorising.
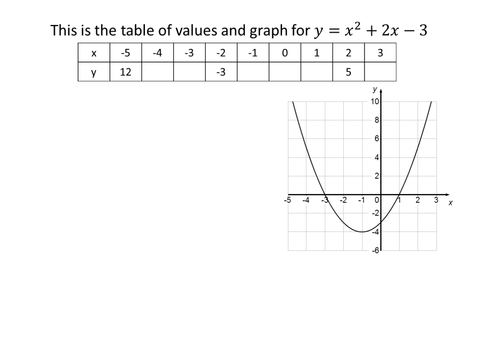
The first two resources (worksheet + powerpoint) can be used to show how the factorised version of a quadratic is linked to the graphical solution of the equation.
The first worksheet has two sections. Section 1 has lots of examples similar to the presentation where they solve the equation using the graph and then by factorising. In section 2 the graph is no longer provided and they just solve the equation by factorising.
The last two worksheets are for additional practice, split into the cases where the coefficient of x^2 is 1 and where it is larger than 1.
All answers are provided.
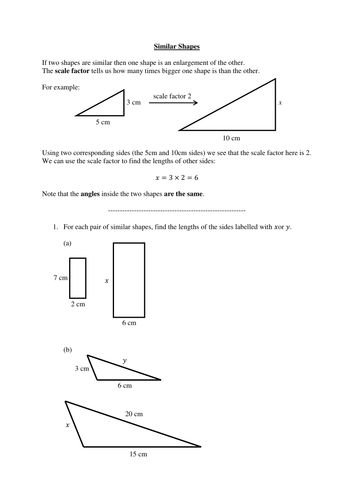
The first worksheet introduces the topic of similar shapes and then has 7 pages of questions about scale factors and the lengths of sides of similar shapes (answers included).
The second resource is intended to be worked through as a class, with each student/group completing it using different values but establishing the same rules about scale factors for areas and volumes of similar shapes.
The third resource is a short worksheet on areas and volumes (answers included).
These resources are for solving linear simultaneous equations using the method of elimination.
The presentation explains how to determine whether to add/subtract the equations to eliminate a variable, and includes the first step in a number of examples. There is a printable version of the presentation for your students to complete as you work through the powerpoint.
The next resource is designed to help your students master the critical first step of deciding whether to add/subtract the equations and performing that operation accurately. There are a few examples to work through as a class and then there are nearly 50 questions for students to complete themselves. Answers are included.
There are then two worksheets for students to work through, both given with and without the answers, so they can be used as classwork or as homework. The first worksheet contains examples that do not require any multiplication, the examples on the second worksheet do require multiplication of at least one of the equations.
These worksheets make teaching/revising these diagrams easier as you can project the axes/diagrams onto a board and your class can work directly on or from the provided axes/diagram.
The worksheet on cumulative frequency is a 6 page document where students get to practise drawing cumulative frequency diagrams and deducing information from them, such as median, interquartile range etc.
The second worksheet introduces how box and whisker plots are drawn and how to interpret them or use them to compare two sets of data.
The third worksheet provides more practice of box and whisker diagrams but then also includes some questions involving cumulative frequency, as these diagrams often appear together in examination questions.
Answers to all the worksheets are included.
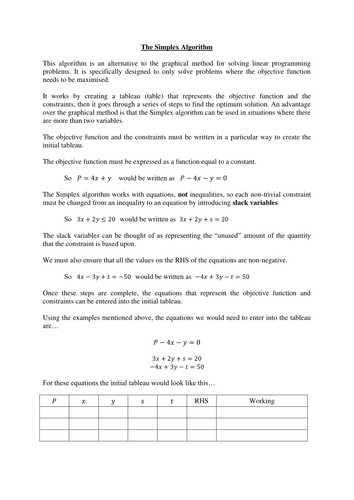
The first resource guides your students through the whole process of using the Simplex algorithm to solve a linear programming problem.
The first page explains how the initial tableau is formed, how the objective function must be written and how the inequalities that represent constraints must be written as equations with the introduction of slack variables.
The first exercise (11 questions) gives them the opportunity to practise writing the initial tableau correctly for different problems. Grids are provided so students focus their time and energy on only the values in the tableau.
The next section describes how an iteration of the algorithm is performed and links the iterations to the graphical solution, showing how each iteration moves to a different vertex of the feasible region.
There is then another exercise with 10 questions for students to practise performing iterations and finding the optimal solution. Again, grids are provided so students focus their time and energy on only the steps of the algorithm and the values in the tableau.
Fully worked solutions are provided to all the questions in the exercises.
The second resource is a spreadsheet that automatically solves any simplex tableau in 2/3 variables with 2/3 constraints - a useful resource for doing/checking solutions to other questions from a textbook or examination paper.
This worksheet covers the types of calculations that are possible with matrices and provides students with plenty of practice of each calculation.
For each type of calculation there is an introduction, some examples to do as a class and then an exercise for students to work through. In total there are over 60 questions for students to complete, all answers to the exercises are provided.
Note that this resource was designed specifically for the Level 2 Further Maths qualification, but can still be used an introduction to calculations with matrices.
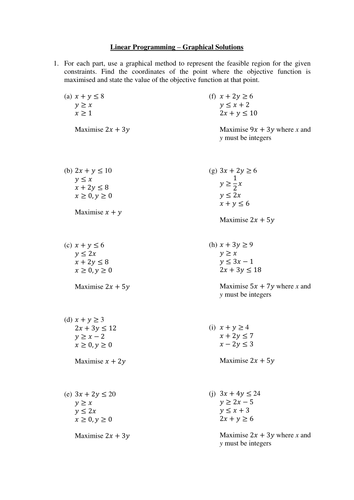
These resources are designed to aid the teaching and learning of using a graphical method to solve linear programming problems.
The first resource introduces the idea of representing inequalities on graphs and finding the point(s) that maximise a given objective function. There are also some examples that require integer solutions so the optimal point is not at a vertex of the feasible region.
The second resource provides practice of solving problems with a provided graph - these are examination style questions and involve considering how changes to the objective function may change the optimal point(s).
The third resource has 2 example questions in context where the students must use a description of a problem to formulate the objective function and the non-trivial constraints, and then go on to solve the problem graphically.
Grids are provided for all graphs and solutions are included for all questions.
The first resource introduces the technique for writing a complex number z=a+bi in (trigonometric) polar form, r(cos (theta)+ i sin(theta)), there are few examples of converting from one form into the other (to do as a class), and then an exercise of 30 questions for students to do. The next section introduces the exponential polar form re^(i theta), a few examples of converting from one form into the other (to do as a class), and then an exercise of questions for students to do. The exercise includes questions that get students to consider what z* and -z look like in both polar forms, as well as investigating multiplying and dividing complex numbers in polar form. Answers to the exercises are included.
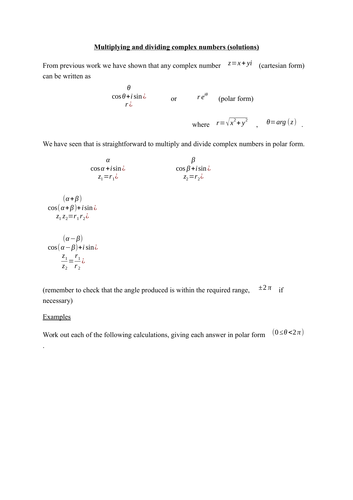
The second resource begins with a reminder of how to multiply/divide complex numbers in polar form, followed by an exercise of questions to practise. The remaining 3 pages cover the geometrical effect of multiplying, with several examples for students to learn from. Fully worked solutions are included.
The final resource focuses on examination-style questions that consider the geometric effect of multiplying by a complex number in polar form. Fully worked solutions are included.
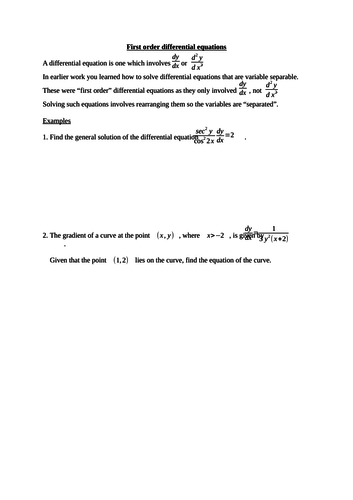
This resource can be used to guide your students through the different techniques that may be used to solve some first order differential equations.
It begins with a reminder about the solution of 'variable separable' equations, with a couple of examples to work through.
By means of an example, the next section shows how the use of an integrating factor can help to solve 1st order linear diff.eqns. After the method is summarised there are a further 2 examples to work through with your class.
The worksheet then mentions the use of a substitution to simplify a complex diff.eqn into either a linear or variable separable one. There are no examples of such equations, just a table for students to practise determining if the resulting simplified equation is linear or variable separable.
The remainder of the resource introduces the important method of finding the general solution by adding the complementary function and the particular integral. It begins with the method for finding the complementary function from the auxiliary equation, and then goes on to explain the method for testing a suitable function f(x) for the particular integral (including the case where the function f(x) appears in the complementary function). There are several examples of this method to work through with your students, followed by an exercise with over 20 questions for students to complete themselves.
Answers to the exercise are included.