Hero image

Daniel Wilson's Shop

Average Rating4.63
(based on 26 reviews)

I'm an A-Level physics teacher. In my opinion independent learning is the key to success so I focus a lot of effort into making resources to help students learn physics independently. A lot of what I make is available for free on YouTube. My website has links to everything. I'm starting to offer my free downloads on https://wonkylogic.co/a-level-physics-hq which does not require a log in to download.

80Uploads

33k+Views

16k+Downloads

I'm an A-Level physics teacher. In my opinion independent learning is the key to success so I focus a lot of effort into making resources to help students learn physics independently. A lot of what I make is available for free on YouTube. My website has links to everything. I'm starting to offer my free downloads on https://wonkylogic.co/a-level-physics-hq which does not require a log in to download.
Resistivity Experiment Worksheet
wilson_dwilson_d

Resistivity Experiment Worksheet

(0)
A worksheet to enable students to analyse experimental data from the resistivity experiment. I’ve made a video of the experiment here youtu.be/0yDtMHlwG3U . The data collected in the video can be used to complete a table and graph. Then the graph can be analysed to determine ρ. There are links from the PDF directly to the relevant part of the data collection in the video for anyone using the worksheet electronically. There are solutions at the end. Perfect for A-level physics students on any specification. This worksheet is ideal for home learning since it has an accompanying video explanation of the experiment, the analysis of results and solutions to all questions are included in the document.
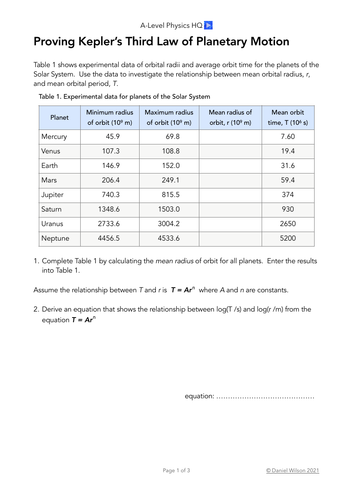
Proving Kepler's Third Law Activity Worksheet and Spreadsheet
wilson_dwilson_d

Proving Kepler's Third Law Activity Worksheet and Spreadsheet

(0)
An activity to guide students through the analysis of real planetary data (orbit radius and period) to see if it is consistent with Kepler’s Third Law. Includes: A worksheet (PDF) for students with complete instructions. This can be issued to students as independent work in class or at home. Space is provided for working out and writing answers to the questions. A Numbers¹ spreadsheet with solutions. There is an Incomplete tab, which can be projected whilst introducing the activity if desired. The Complete tab has all the solutions to aid the teacher as they work through it with the class. Solutions include results computed directly from the data using spreadsheet formulae and a separate table in which results from a hand drawn graph can be inputted and computed. The Printable tab has the solutions in a printable format if needed. The Incomplete and Printable tabs from the spreadsheet are also included as separate PDFs for anyone unable to use the Numbers app. ¹ This is a Numbers spreadsheet. It is possible to convert Numbers spreadsheets to Excel files but I cannot guarantee an easy to use output since the tables may be converted to separate worksheets in the Excel file.
Solar System Orbits Animated Banner for Google Classroom
wilson_dwilson_d

Solar System Orbits Animated Banner for Google Classroom

(0)
Take your Google Classroom to the next level with a cool science-themed animated banner! Eight planets of the solar system orbit the Sun. Orbit timings are not to scale - this is just for fun! You’ll need to download it before you see the animation. An I ♥ Science Resource by Wonky Logic
Young’s Modulus Experiment Worksheet
wilson_dwilson_d

Young’s Modulus Experiment Worksheet

(0)
A worksheet to enable students to analyse experimental data from the Young’s Modulus experiment. I’ve made a video of the experiment here youtu.be/xASsYJo3zrM . The data collected in the video can be used to complete a table and graph. Then the graph can be analysed to determine E. There are links from the PDF directly to the relevant part of the data collection in the video for anyone using the worksheet electronically. There are solutions at the end. Perfect for A-level physics students on any specification. This worksheet is ideal for home learning since it has an accompanying video explanation of the experiment, the analysis of results and solutions to all questions are included in the document.
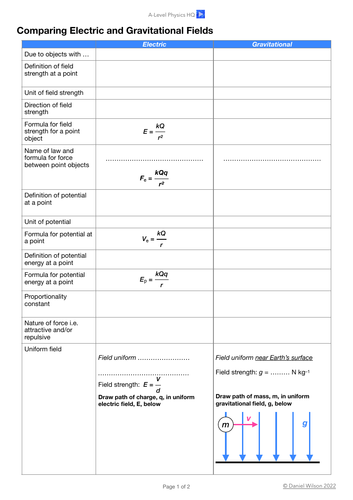
Comparing Electric and Gravitational Fields Worksheet
wilson_dwilson_d

Comparing Electric and Gravitational Fields Worksheet

(0)
A summary activity to facilitate students comparing electric and gravitational fields. The nature of the fields, direction, definitions, units, equations (strength, potential and potential energy) paths of objects with mass/charge are included. The comparison is done by field property in a tabulated layout. Page 1 is designed for students to write onto directly. Page 2 has solutions.
Photoelectric effect sorting activity
wilson_dwilson_d

Photoelectric effect sorting activity

(0)
Revise the key concepts of the photoelectric effect with these two sorting activities. Activity 1 reinforces the relationship between colour, wavelength and photon energy for visible photons. Activity 2 extends activity 1 by introducing differences in intensity. Included in this bundle are: Sorting cards for both activities (PDF files). On page two are optional header columns to help students structure their solutions. Presentation files for teachers to project the correct solutions to the class (a Keynote file for Mac/iOS users and PowerPoint file for Windows users). Suitable for A-Level physics specifications: AQA and OCR Physics A AS-Level and A-Level specifications. (7407, 7408, H156, H556)
Visible Spectrum Animated Banner (GIF)
wilson_dwilson_d

Visible Spectrum Animated Banner (GIF)

(0)
Take your Google Classroom to the next level with a cool science-themed animated banner! Seven colours of the visible spectrum glide into view with wavelengths displayed. Sadly you’ll need to download it before you see the animation. An I ♥ Science Resource by Wonky Logic
Specific Heat Capacity Experiment Worksheet
wilson_dwilson_d

Specific Heat Capacity Experiment Worksheet

(0)
A worksheet to enable students to analyse experimental data from the specific heat capacity experiment. I’ve made a video of the experiment here youtu.be/CJTfyD7aiL4 . The data collected in the video can be used to complete a table and answer a series of calculation questions in order to determine c for copper and aluminium. Copper and aluminium are handled on separate pages. There are links from the PDF directly to the relevant part of the data collection in the video for anyone using the worksheet electronically. There are solutions at the end. An excellent extension activity is the heat capacity evaluation worksheet. Perfect for A-level physics students on any specification. This worksheet is ideal for home learning since it has an accompanying video explanation of the experiment, the analysis of results and solutions to all questions are included in the document.
Light intensity and distance analysis spreadsheet
wilson_dwilson_d

Light intensity and distance analysis spreadsheet

(0)
A spreadsheet that can be used to analyse the data obtained in the experiment to investigate light intensity and distance like in this video. The spreadsheet automatically calculates the power of the light source and percentage difference with the manufacturer’s rating from inputted distance and light intensity data. The data plots are added to a carefully formatted graph. A line of best fit is automatically plotted. The gradient of the line is automatically calculated from the data plots and the value of the source power is calculated by using the gradient. This spreadsheet is perfect for rapidly analysing experimental data. A second table calculates proportionality constants so that the user can very quickly check if their data obeys an inverse square law. This is a Numbers spreadsheet. It is possible to convert Numbers spreadsheets to Excel files but I cannot guarantee an easy to use output since the tables may be converted to separate worksheets in the Excel file.
Graph Grids - 8 × 12 and 10 × 14 large squares
wilson_dwilson_d

Graph Grids - 8 × 12 and 10 × 14 large squares

(0)
Graph grids for digital graph work in PDF format - use with iPads / tablets and Apple Pencils / styluses etc. The grids available are 8 × 12 and 10 × 14 large squares - each large square being 10 × 10 small squares. Can be used in portrait or landscape.
Gas Pressure Law analysis spreadsheet
wilson_dwilson_d

Gas Pressure Law analysis spreadsheet

(0)
Copy of the spreadsheet I used to analyse the pressure law experiment in this video. This is a Numbers spreadsheet. It is possible to convert Numbers spreadsheets to Excel files but I cannot guarantee an easy to use output since the tables may be converted to separate worksheets in the Excel file.
Current balance (magnetic flux density) analysis spreadsheet
wilson_dwilson_d

Current balance (magnetic flux density) analysis spreadsheet

(0)
Copy of the spreadsheet I used to analyse the current balance experiment in this video. This is a Numbers spreadsheet. It is possible to convert Numbers spreadsheets to Excel files but I cannot guarantee an easy to use output since the tables may be converted to separate worksheets in the Excel file.
Physics Graphs Revision Activity (Not Differentiated)
wilson_dwilson_d

Physics Graphs Revision Activity (Not Differentiated)

(0)
Help your students practice recall of graph shapes and features across most physics subject areas (A-level and equivalent). Included is a PDF that has blank graph grids and labelled axes for students to draw onto. The introduction and solutions are included in the PDF document; printing them is optional. A differentiated version of this activity is available for purchase with included Keynote¹ slideshow introduction and solutions (the solutions are animated to give the option of an interactive activity with your students - draw the solution, compare the textbook answer and discuss). Graphs included in this activity: Radioactive Decay Capacitor Decay Binding Energy Binding Energy per Nucleon Gravitational Field Strength v. Distance Filament Bulb I-V Characteristic Gravitational field strength v. 1/distance² Stress-Strain Profile of Copper R-T Relationship for Metal Conductor Photoelectric Effect ¹ Keynote is presentation software that works on Macs, iOS and iPadOS devices.
Magnetic Flux Density Experiment Worksheet (Current Balance)
wilson_dwilson_d

Magnetic Flux Density Experiment Worksheet (Current Balance)

(0)
A worksheet to enable students to analyse experimental data from the current balance experiment to determine the magnetic flux density of a major magnet. I’ve made a video of the experiment here youtu.be/N4H1X4i2OZ4. The data collected in the video can be used to complete a table and graph and answer a series of questions to analyse the graph in order to determine B for the magnet. There are links from the PDF directly to the relevant part of the data collection in the video for anyone using the worksheet electronically. There are solutions at the end. Perfect for A-level physics students on any specification. This worksheet is ideal for home learning since it has an accompanying video explanation of the experiment, the analysis of results and solutions to all questions are included in the document.
Heat capacity experiment analysis spreadsheet
wilson_dwilson_d

Heat capacity experiment analysis spreadsheet

(0)
Copy of the spreadsheet that can be used to analyse the heat capacity experiment in this video. This is a Numbers spreadsheet. It is possible to convert Numbers spreadsheets to Excel files but I cannot guarantee an easy to use output since the tables may be converted to separate worksheets in the Excel file. Suitable for most A-level physics specifications.
Explain intensity in the photoelectric effect (slideshow)
wilson_dwilson_d

Explain intensity in the photoelectric effect (slideshow)

(0)
A simple presentation to aid explanation of the role of radiation intensity in the photoelectric effect once the threshold frequency of the metal has been exceeded. Students often misunderstand the inability of increased intensity to trigger the photoelectric effect and therefore believe it has no role. This presentation is a visual aid to help the teacher show that it has a role in controlling the number of photons arriving per unit time. This presentation compares a source of low intensity blue with high intensity blue light (where blue light has a frequency above the threshold frequency). This is a Keynote presentation (macOS, iPadOS and iOS). Useful for all A-Level physics specifications. The photoelectric effect is an important experiment in physics that proves that light behaves like a particle, it was a founding experiment for quantum theory. Einstein won his Nobel prize for his work on explaining the photoelectric effect.
Equations of uniform acceleration spreadsheet model
wilson_dwilson_d

Equations of uniform acceleration spreadsheet model

(0)
This spreadsheet will solve your problems involving the equations of uniform acceleration. If you’re a physics teacher you’ll need to solve a lot of these problems at certain times of the year, you may even need to invent your own questions. This may speed up your workflows. Simply input your data (s u v a and t) typing a question mark by the unknown quantity. Then select the equation you need to use from a drop down menu and the answer is calculated. Calculations are performed on a background table, so at any time you can investigate what’s happening on that tab. Questions that lead to two values of t (due to the square root in some solutions) are solved and both values of t are shown.
Transformers Turns Ratio Equation Experiment Worksheet
wilson_dwilson_d

Transformers Turns Ratio Equation Experiment Worksheet

(0)
A worksheet to enable students to analyse experimental data from the experiment to investigate the transformers turns ratio equation (V₁ / V₂ = N₁ / N₂). I’ve made a video of the experiment here https://youtu.be/rXzTp4dzjGw. The data collected in the video can be used to complete a table, plot a graph and answer a series of analysis questions in order to explain if the equation is supported by the data that was collected. An additional extension guides students through the manual calculation of R². Instructions for computation of standard deviation on popular CASIO calculators are also included. Yup all this for free! There are links from the PDF directly to the relevant part of the data collection in the video for anyone using the worksheet electronically. There are solutions at the end. Perfect for A-level physics students on any specification. This worksheet is ideal for home learning since it has an accompanying video explanation of the experiment, the analysis of results and solutions to all questions are included in the document. One thing to note: I mistakenly used a different set of results in my analysis video. I’m sorry about that. However, the analysis methodology is still relevant.
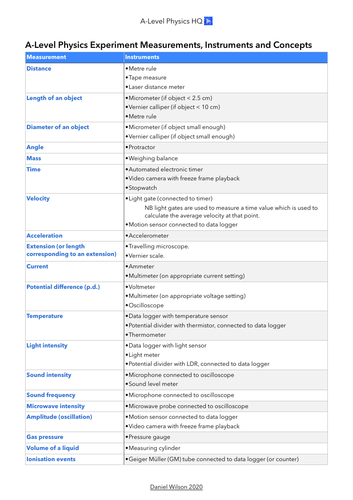
Experiment Measurements, Instruments and Concepts for A-Level Physics
wilson_dwilson_d

Experiment Measurements, Instruments and Concepts for A-Level Physics

(0)
The measurements, instruments and concepts to describe and explain in exam questions about physics practical work. Measurements to Take: Distance / Length, Small Distance / Length / Diameter, Time, Launch / Final Velocity, Temperature, Voltage, Current and more! Common Relationships to Investigate: Direct and Inverse proportionality And How to Investigate Relationships. Suitable for OCR Physics A, AQA Physics and Edexcel physics.