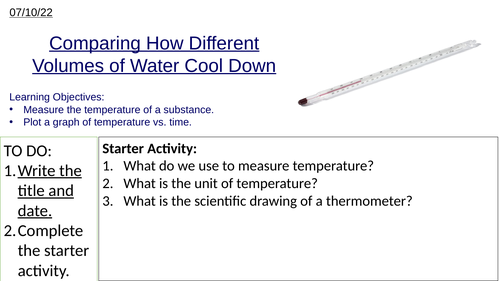

PowerPoint that covers the following learning objectives:
- Measure the temperature of a substance.
- Plot a graph of temperature vs. time.
In this investigation, students will compare how a large beaker of hot water and a small beaker of hot water cool down differently. They will form a research question, hypothesis, fill in table of results, plot line graphs and form a conclusion.
PowerPoint includes research question, hypothesis, method, graphs and conclusion.
If you could spare 5 minutes, please review this resource, to help my online presence grow! :)
Something went wrong, please try again later.
This resource hasn't been reviewed yet
To ensure quality for our reviews, only customers who have purchased this resource can review it
Report this resourceto let us know if it violates our terms and conditions.
Our customer service team will review your report and will be in touch.
£2.00