
2 worksheets:
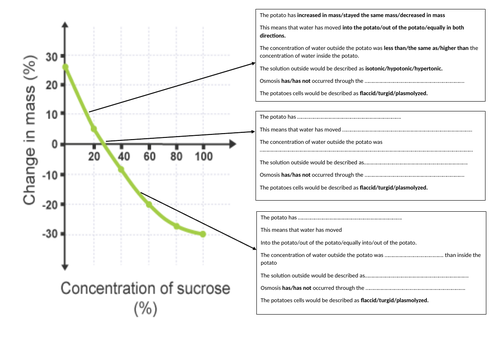
- Example results to plot an osmosis graph.
- Osmosis graph which includes statements about the what is occuring at each point.
Something went wrong, please try again later.
Very useful scaffolding activity for mixed ability class.
Report this resourceto let us know if it violates our terms and conditions.
Our customer service team will review your report and will be in touch.
£1.00
