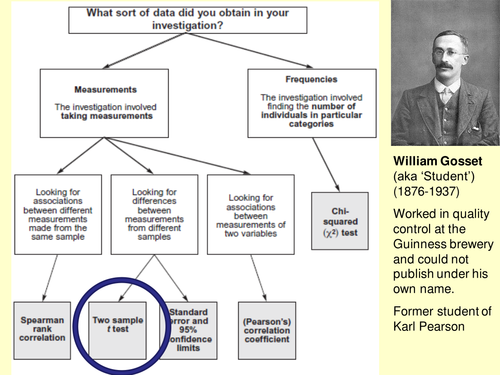

This PowerPoint provides an overview and step-by-step method for calculating standard deviation and a value for t using a set of sample data. The formula and notation used are in line with the AQA GCE Human Biology Students' Statistics Sheet (version 2.2). Spreadsheet included to provide raw data, if required.
Something went wrong, please try again later.
very clear - thank you
Great resource, thank you
very good
Good level of detail for students who want to take their learning further.
Thank you. Great resource. I think there is a typo in the first column (Group 1), first row (pot 1) of the worked example, the answer is 1,21 not 1.27.
Report this resourceto let us know if it violates our terms and conditions.
Our customer service team will review your report and will be in touch.
£0.00
