

Have you seen Z charts before? No neither had I. But they are in the AQA GCSE Statistics syllabus and I couldn't find a decent amount of questions on it. These questions have been picked from here and there and the powerpoint gives an introduction to talk through.
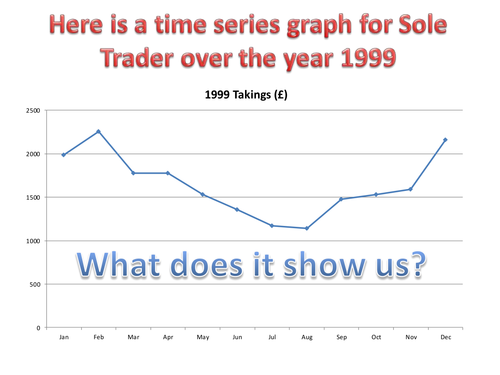
The final slide is intended as a plenary to demonstrate the drawbacks of Z charts.Both graphs show the same data but the scaling on the Z chart causes the monthly totals to appear steady, the moving average graphs make things a lot clearer.
Something went wrong, please try again later.
Great piece of work - spot on! I like the detailed yet summarised approach of the w/sheet.
Great resource!
Thanks for this, it is very helpful indeed. :)
Thank you for filling a gap - it is much needed. I am trialling the worksheet as a home learning exercise, having given the students a lesson on how to plot and interpret Z charts.
Report this resourceto let us know if it violates our terms and conditions.
Our customer service team will review your report and will be in touch.
£0.00