155Uploads
218k+Views
225k+Downloads
Economics

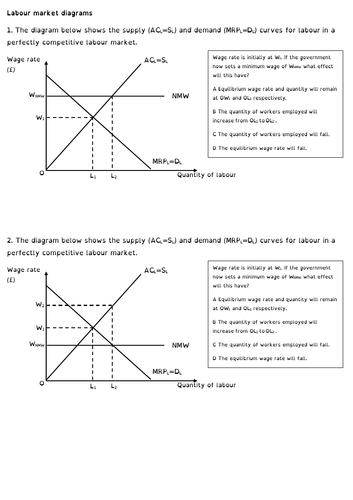
A-level Economics Labour market diagrams practice
A worksheet to test comprehension of labour market diagrams. Separate mark scheme included.
Any suggestions/improvements/complaints please do comment and I will update it for future editions.
The font is OpenDyslexic - Free, OpenSource Dyslexia Typeface
http://opendyslexic.org/

A-level Economics Trade unions
A-level Economics lesson on trade unions. Includes:
Presentation on trade unions
Key word glossary (1 Trade unions definitions.pdf)
Worksheet on the impact of trade unions on employment and wage rate in imperfectly competitive labour markets (2 Impact of trade unions on the labour market.pdf)
Worksheet for students to identify and shade in the areas of total wages and lost wages from underpayment under monopsony and with a trade union; and the areas of employers’ surplus, workers’ surplus and deadweight loss under monopsony and with a trade union (3 Effect of trade unions on wages and efficiency.pdf)
Any suggestions/improvements/complaints please do comment and I will update it for future editions.
The font is OpenDyslexic - Free, OpenSource Dyslexia Typeface
http://opendyslexic.org/

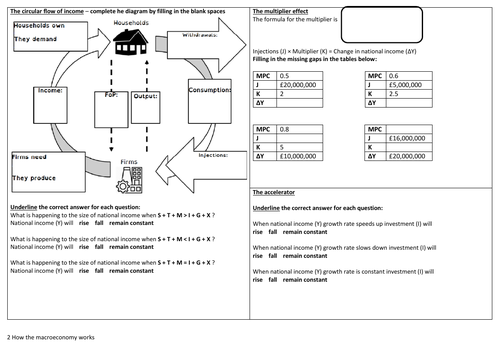
AQA A-level Economics How the macroeconomy works knowledge organiser
Knowledge organiser for the How the macroeconomy works topic from the AQA A-level Economics. Includes a set of example answers.
Any suggestions/improvements/complaints please do comment and I will update it for future editions.

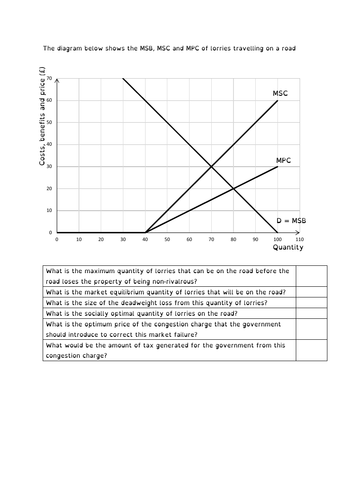
A-level Economics The case for road pricing activity
A worksheet to test comprehension of diagrams illustrating congestion for roads which are quasi-public goods. Separate suggested answers included.
The font is OpenDyslexic - Free, OpenSource Dyslexia Typeface
http://opendyslexic.org/

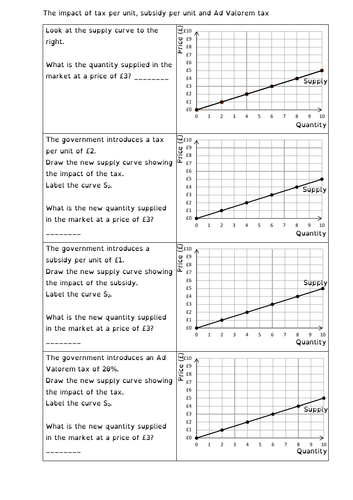
The impact on market supply of tax per unit, subsidy per unit and Ad Valorem tax
A worksheet to show the impact of impact on market supply of tax per unit, subsidy per unit and Ad Valorem tax. Separate suggested answers included.
The font is OpenDyslexic - Free, OpenSource Dyslexia Typeface
http://opendyslexic.org/

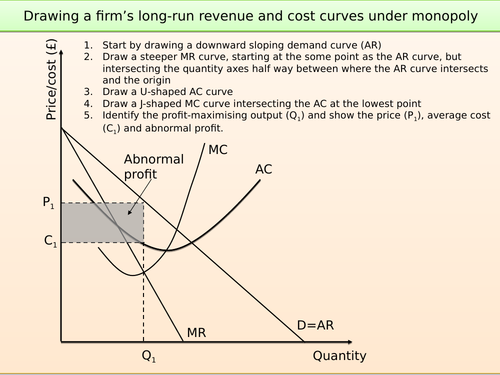
Drawing firms' revenue and cost curves under different market structures
An animated slideshow explaining how to draw firms’ revenue and cost curves under monopoly, monopolistic competition, perfect competition and oligopoly.
The font is OpenDyslexic - Free, OpenSource Dyslexia Typeface
http://opendyslexic.org/

Calculating changes in real GDP per capita from changes in nominal GDP, price level and population
A set of exercises to practice calculating changes in real GDP per capita from changes in the index for nominal national income, price level and population. At the end are a series of True or False questions to test understanding and summerise the learning. A copy of the answers has been included, as well as a slideshow to explain the answers.
If you are not familiar with using index numbers, I suggest covering that lesson first:
https://www.tes.com/teaching-resource/aqa-a-level-economics-index-numbers-11969724
The font is OpenDyslexic - Free, OpenSource Dyslexia Typeface
http://opendyslexic.org/

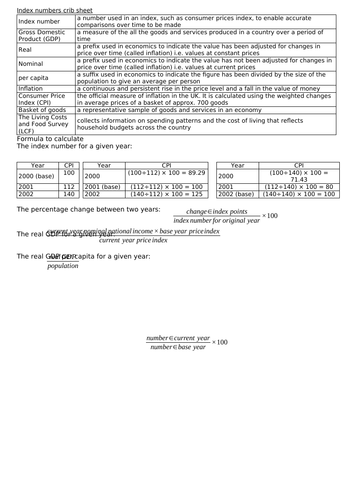
A-level Economics Index numbers crib sheet
A crib sheet covering Index numbers for A-level Economics students
Both .pdf and .docx file formats have been included.
The font is OpenDyslexic - Free, OpenSource Dyslexia Typeface
http://opendyslexic.org/

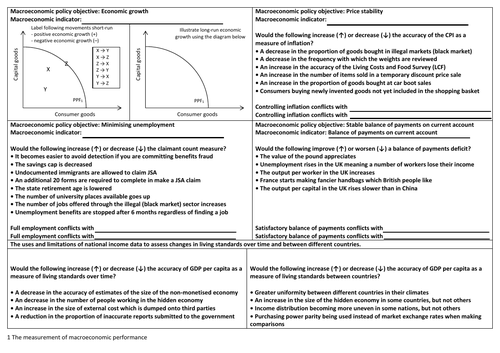
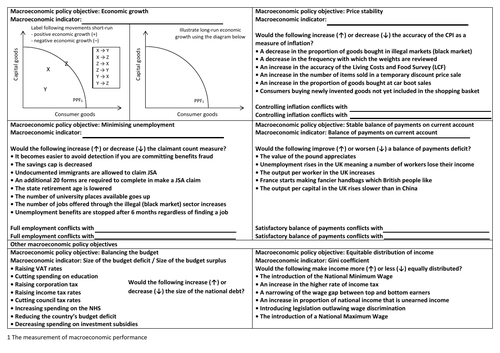
AQA A-level Economics The measurement of macroeconomic performance knowledge organiser
Knowledge organiser for The measurement of macroeconomic performance topic from the AQA A-level Economics. Includes a set of example answers.
There is a version of this with AS and Year 12 Economics content which can be found here:
https://www.tes.com/teaching-resource/aqa-as-and-year-12-the-measurement-of-macroeconomic-performance-knowledge-organiser-12412772
Any suggestions/improvements/complaints please do comment and I will update it for future editions.

AQA AS and Year 12 Economics The measurement of macroeconomic performance knowledge organiser
Knowledge organiser for The measurement of macroeconomic performance from the AQA AS and Year 12 Economics. Includes a set of example answers.
There is a version of this with A-level Economics content which can be found here:
https://www.tes.com/teaching-resource/aqa-a-level-the-measurement-of-macroeconomic-performance-knowledge-organiser-12412807
Any suggestions/improvements/complaints please do comment and I will update it for future editions.

AQA A-level Economics Bank of England response to Covid-19
A 9 mark question on Bank of England’s response to Covid-19. Both .pdf and .doc file formats have been included.
The font is OpenDyslexic - Free, OpenSource Dyslexia Typeface
http://opendyslexic.org/

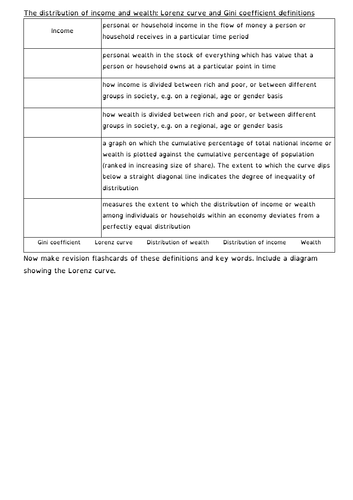
A-level Economics (and Geography) The Lorenz curve and Gini coefficient
Complete lesson on the Lorenz curve and Gini coefficient.
Includes 3 worksheets:
glossery for students fill in
drawing the Lorenz curve
calculating the Gini coefficient
Included in the slides is also a number of MCQs and 15 mark exam question from AQA A-level Economics with a suggested plan, sample student responses and mark scheme.
Some of the font is in OpenDyslexic - Free, OpenSource Dyslexia Typeface
http://opendyslexic.org/

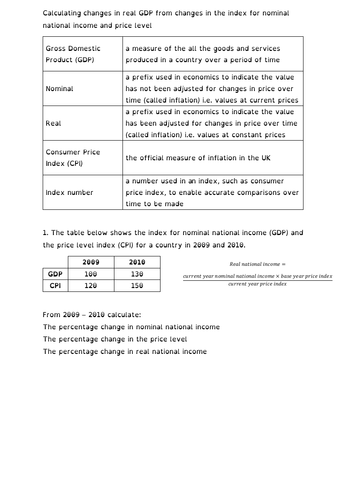
Calculating changes in real GDP from changes nominal national income and price level
01/10/2020 - Updated to include a slideshow to explain the answers
A set of exercises to practice calculating changes in real GDP from changes in the index for nominal national income and price level. At the end are a series of True or False questions to test understanding and summerise the learning. A copy of the answers has been included.
If you are not familiar with using index numbers, I suggest covering that lesson first:
https://www.tes.com/teaching-resource/aqa-a-level-economics-index-numbers-11969724
The font is OpenDyslexic - Free, OpenSource Dyslexia Typeface
http://opendyslexic.org/

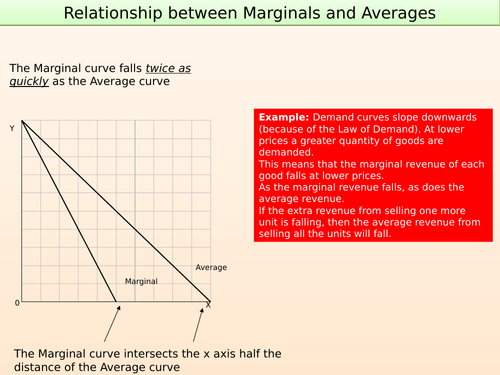
Marginal, Average and Total relationship
A presentation to explain, with examples, the relationship between Marginal, Average and Total values.
Economic concepts used as examples are the Law of Demand, the Marginal cost of labour, the law of Diminishing marginal utility, internal economies of scale and internal diseconomies of scale, division of labour and the law of Diminishing marginal returns.
Both .pptx and .pdf versions have been included.
The font is OpenDyslexic - Free, OpenSource Dyslexia Typeface
http://opendyslexic.org/

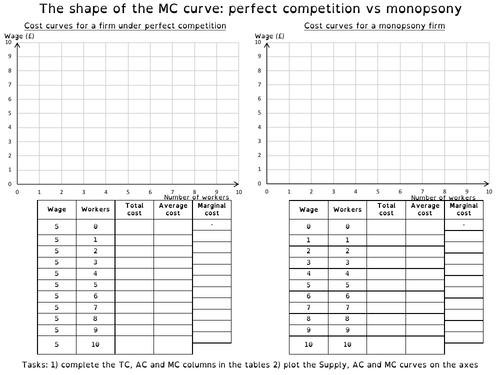
MC curve: perfect competition vs monopsony
An exercise to explain the shape of the MC curves that firms face under perfect competition vs monopsony.
An answer sheet is provided as well as the answers being included on the second slide of the attached slideshow.
The font is OpenDyslexic - Free, OpenSource Dyslexia Typeface
http://opendyslexic.org/

A-level Economics Price discrimination
A-level Economics lesson on price discrimination. Includes:
Presentation on price discrimination
Worksheet so students can see how a combined market can be divided into smaller markets (Price discrimination 10 people want to use the bus.pdf)
Worksheet so students so students can see what the impact of price discrimination is on economic surplus (Price discrimination and economic surplus.pdf)
Handout so students so students can identify different kinds of price discrimination, advatantages of price discrimination to producers and consumers and a case study to plan an essay response on the topic of price discrimination (Price discrimination.pdf)
Any suggestions/improvements/complaints please do comment and I will update it for future editions.
The font is OpenDyslexic - Free, OpenSource Dyslexia Typeface
http://opendyslexic.org/

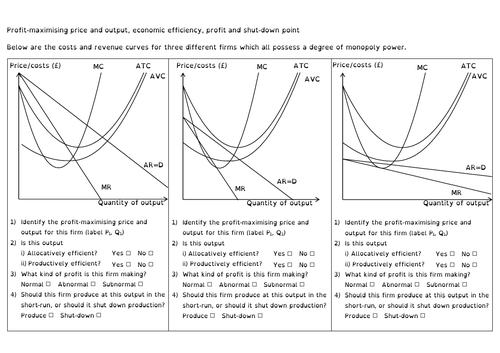
Monopolistic competition: profit-maximisation, efficiency, profit and shut-down point
An exercise to identify profit-maximising price and output, economic efficiency, profit and shut-down point under monopolistisic competition.
An answer sheet is provided as well as the answers being included on the attached slideshow.
The font is OpenDyslexic - Free, OpenSource Dyslexia Typeface
http://opendyslexic.org/

No-nonsense guide to progressive tax
A no-nonsense guide to progressive income tax.
The font is OpenDyslexic - Free, OpenSource Dyslexia Typeface
http://opendyslexic.org/

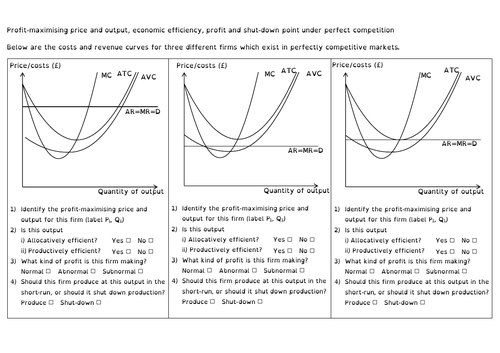
Perfect competition: profit-maximisation, efficiency, profit and shut-down point
An exercise to identify profit-maximising price and output, economic efficiency, profit and shut-down point under perfect competition.
An answer sheet is provided as well as the answers being included on the attached slideshow.
The font is OpenDyslexic - Free, OpenSource Dyslexia Typeface
http://opendyslexic.org/

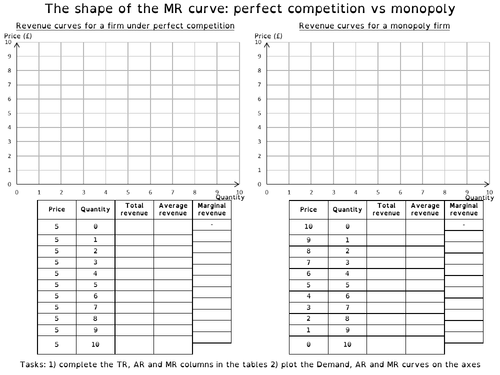
MR curve: perfect competition vs monopoly
An exercise to explain the shape of the MR curves that firms face under perfect competition vs monopoly.
An answer sheet is provided as well as the answers being included on the second slide of the attached slideshow.
The font is OpenDyslexic - Free, OpenSource Dyslexia Typeface
http://opendyslexic.org/

