130Uploads
944k+Views
1089k+Downloads
Mathematics

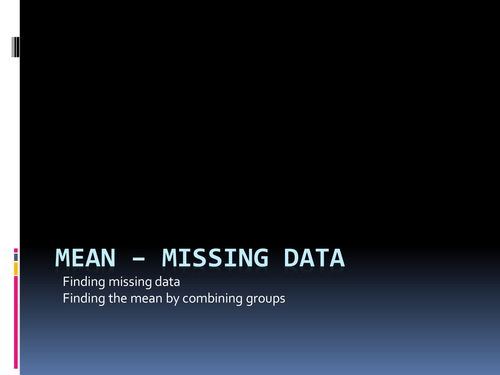
Mean - missing data and combined data
Find the missing number given mean and other numbers. Find mean of combined data sets.
Could use with mini-whiteboards as each step animated.
(16/6/14 added WALT and starter)

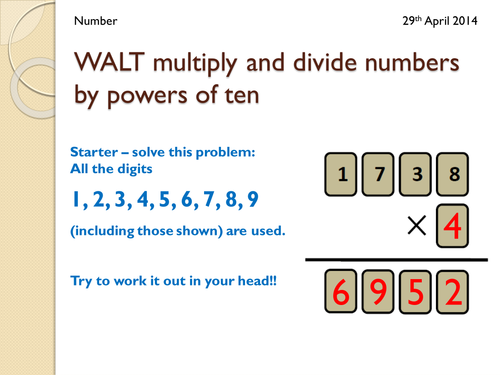
Multiplying and dividing by powers of ten
Two main slides showing visually place value adjustment when multiplying/dividing by 10, 100, 1000. Plus puzzle starter. You may just want to use the two main slides in a PowerPoint of your own!

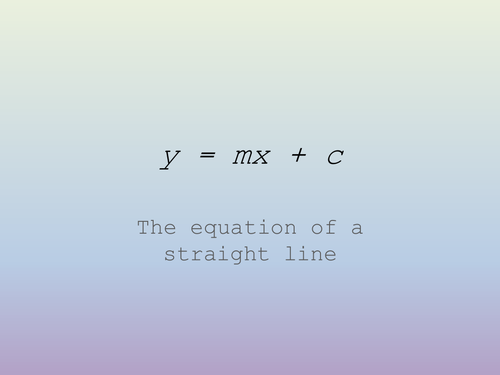
y=mx+c step-by-step
A set of 8 graphs to 'talk' through (use mini-whiteboards?) to recognise intercept and gradient

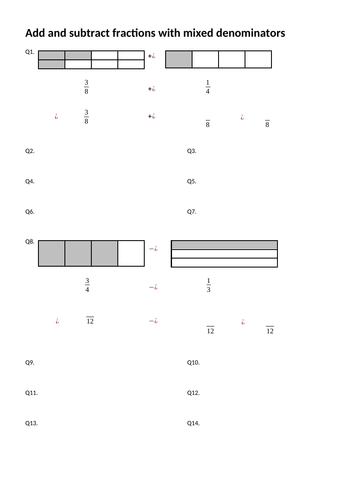
Add/sub fractions with mixed denominators
Short, scaffolded worksheet for adding and subtracting fractions. For lower ability group. (25/1/19 PDF version added.)

Solving equations - balanced scales
Illustration of balanced scales for solving equations. 1 and 2-step. [21/1/15] Simple matching worksheet added for 1-step equations. [3/3/15] New version of presentation showing how to deal with the variable on both sides.
(12/7/16) Answers to worksheet uploaded

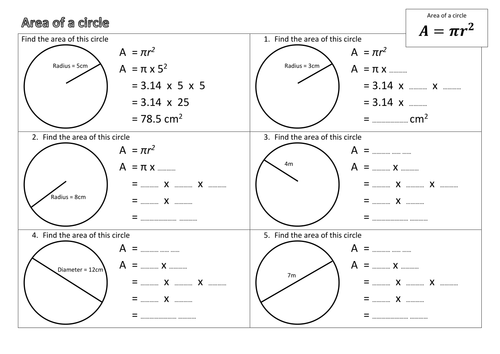
Area of circles - scaffolded worksheet
Scaffolded worksheet with 5 simple questions on area of a circle.

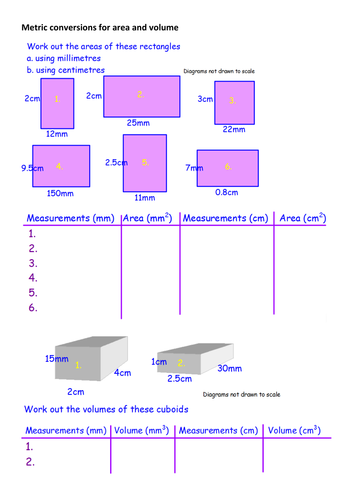
Metric conversions for area and volume
Straight-forward examples for area/volume using mixed units for length. Can they see relationship?

Interior and exterior angles
Worksheet to draw and measure interior and exterior angles for a pentagon. 2nd worksheet to divide polygons into triangles for total interior angles.
(I have previously posted a worksheet to complete for int/ext angles of regular polygons)
(12/7/16) Answers uploaded for 2nd sheet

Circle theorems - flash card quiz
Quick 10 question quiz - identify correct theorem to use to solve problem. (No solutions required.)

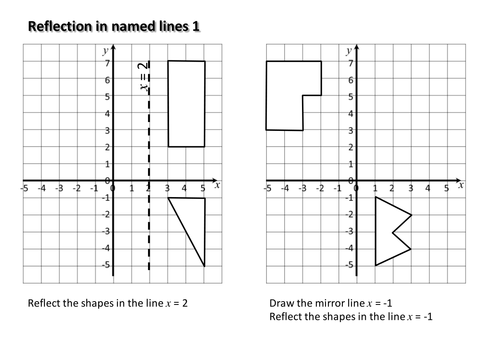
Reflections in named lines: KS3 / KS4 Maths
First worksheet is a starter getting learners to name lines like x=2 and y=1. (It is assumed this has been covered previously.) Second worksheet asks students to draw reflections in named lines. (It is assumed they have drawn reflections in general before.)
(12/7/16) Answers uploaded for reflections worksheet

Types of data - discrete vs continuous
Qualitative vs quantitative, discrete vs continuous. 1. Cards to sort into two groups - may think of any way to split. 2. Flipchart to structure lesson with links to short videos etc. 3. PowerPoint quiz - identify whether discrete or continuous.

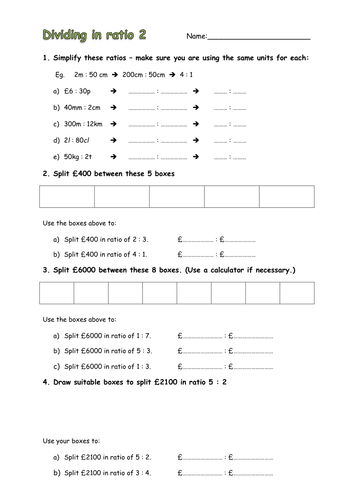
Dividing in ratio
Powerpoint demonstrating how to divide sums of money in ratio and accompanying scaffolded worksheet with (fairly) straight-forward examples to work out. (10/2/14) Second, slightly harder, worksheet added.
(12/7/16) Answers uploaded

Transformations summary quiz
Flash card (or other) quiz as summary or check-in for 4 basic transformations. 10 Qs. Centre rotation/enlargement not covered or vector form for translation.

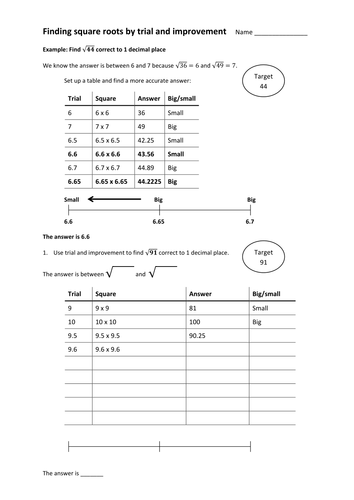
Trial and improvement - square and cube roots
Relatively simple, structured worksheet on using trial and improvement to find square and cube roots to 1 decimal place using second d.p. (Can ignore latter and just find closest to 1 d.p.) 7/3/14 Slightly improved versions replacing originals and another new 'problem'.

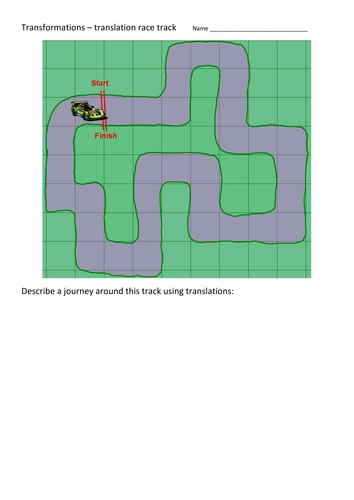
KS3 Maths: Translations race track
Simple intro to translations. Describe movement of car around track using translations. Draw own track and do the same. Promethean flipcharts (old and new versions) and worksheet.

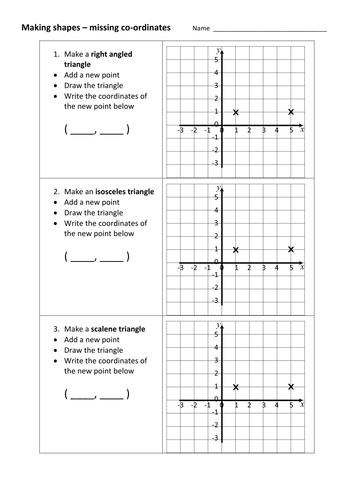
Make 2-D shapes from missing coordinates
Find the coordinates that creates the required shape - some of the problems have more than one answer. Others (assuming you use integer values and stay on the grid) do not. Various triangles, square, parallelogram, rhombus, trapezium.
Final page to identify given shapes - named, congruent, enlargement.

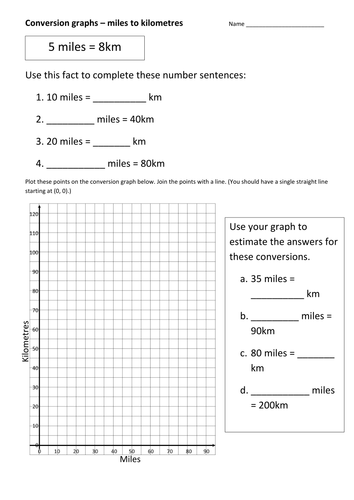
Draw and interpret conversion graph - miles to km
Scaffolded worksheet asking students to find 4 points, plot these on a conversion graph of miles to km and then use the line to convert 4 other values.
(10/2/14) Two further examples added. (12/7/16) Answers uploaded

