Links together expanding triple brackets with expanding brackets involving surds.
As the work sheets progress, students are required to simply their surds and collect ‘like surds’.
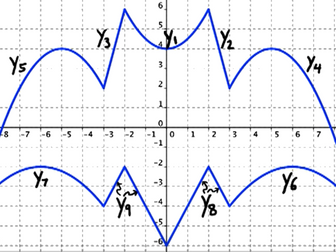
Students to complete the tables of values for the given quadratic and linear equations between the specified values of x. when they sketch the graphs on the same axes it will create the Batman image. The PowerPoint then investigates the affects of changing the values of ‘a’, ‘c’ and then ‘b’ on a quadratic equation. Differentiate the activities by allowing different students different combinations of the equations, table of values and the axes.
The Batman activity can also be used at A-level when teaching range and domain - y9 and 8 can then be achieved using modulus as apposed to two separate linear equations.
 Quick View