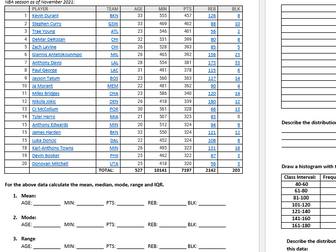
 Quick View
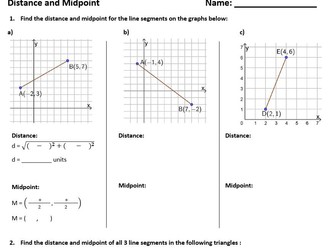
Calculating Distance and Midpoint
<p>Students can practice calculating the distance and midpoint on a line segment on a Cartesian plane as well as from a set of coordinates.</p>
<p>There is a range of scaffolding available:<br />
Bronze - fully scaffolded<br />
Silver - introductory scaffolding<br />
Gold - no scaffolding at all</p>