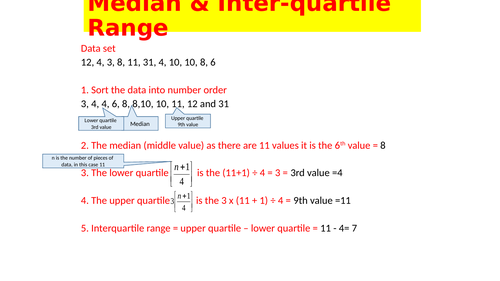

This lesson contains a worked example followed by a series of exercises where the students can practice and apply their knowledge. Included within the PowerPoint are worksheets for the students to fill in and a full set of answers, including worked calculations. I have included two dispersion diagrams to be used to calculate the interquartile range. I designed these to be used either as homework tasks or as an introductory lesson / skill practice lesson. They are also designed to encourage the students to memorise the formulae as these will not be included in the exam papers even at GCSE level.
Get this resource as part of a bundle and save up to 0%
A bundle is a package of resources grouped together to teach a particular topic, or a series of lessons, in one place.
Something went wrong, please try again later.
This resource hasn't been reviewed yet
To ensure quality for our reviews, only customers who have purchased this resource can review it
Report this resourceto let us know if it violates our terms and conditions.
Our customer service team will review your report and will be in touch.