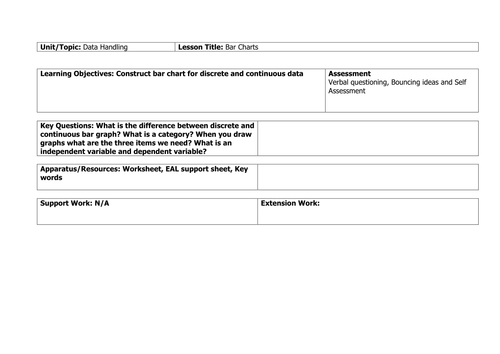
A great free resource for students to construct bar chart for discrete and continuous data. Full detailed lesson plan, resources, task, differentiation and a fill in the blanks plenary.
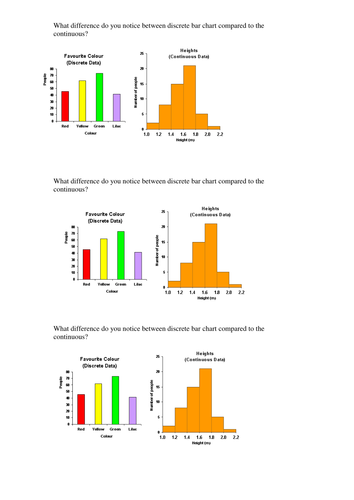
Some useful resources here, but I was hoping for a bit more data, even grouping it. The continuous data should be given with proper class intervals using inequalities
Empty reply does not make any sense for the end user