

This is the 2nd lesson for the new GCSE chemistry scheme-section 6-Rates.
Students learn to calculate the rate of reaction from graphs drawn from experimental data.
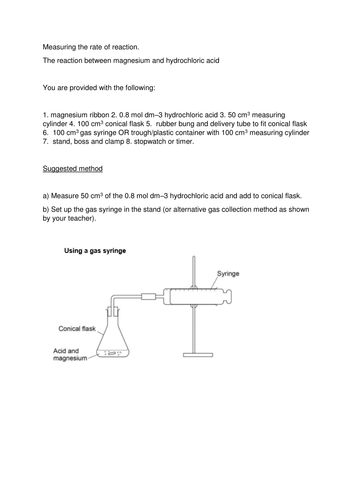
Attached is a method sheet for students to gain results but they could be given some data if you prefer.
I have also attached an exam question and the answer to assess students knowledge.
Students learn to calculate the rate of reaction from graphs drawn from experimental data.
Attached is a method sheet for students to gain results but they could be given some data if you prefer.
I have also attached an exam question and the answer to assess students knowledge.
Something went wrong, please try again later.
This resource hasn't been reviewed yet
To ensure quality for our reviews, only customers who have purchased this resource can review it
Report this resourceto let us know if it violates our terms and conditions.
Our customer service team will review your report and will be in touch.
£2.00
