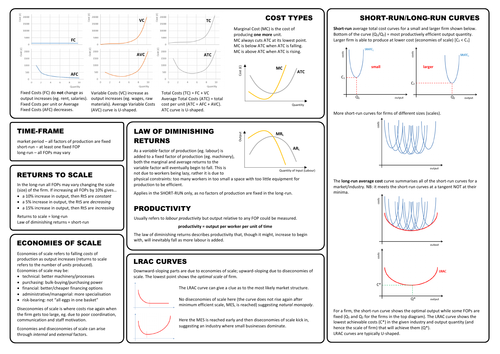


This was designed as a revision activity to pull together on one A3 sheet some key information and diagrams that students often get muddled with: the relationship between short-run ATC curves and the LRAC curve; the difference between the Law of Diminishing Returns, Returns to Scale and Economies of Scale; and by putting them on one page to help students see the connections between concepts.
Included (in both Word and PDF formats) are a ‘template’ sheet so that students can fill in the information themselves, a completed version, and A-level exam questions (drawn from old spec ECON3 and the new papers) that would allow students to practice the use of this information in an exam context.
Lots of ways of using this resource, and it will apply beyond the current AQA A-level specification.
The diagrams are all lifted from my Powerpoints, also available on TES.
Feedback always welcome (particularly if you spot any errors!)
[updated 04/2019 with M/C answers and additional questions from recent papers]
Get this resource as part of a bundle and save up to 25%
A bundle is a package of resources grouped together to teach a particular topic, or a series of lessons, in one place.
Something went wrong, please try again later.
This resource hasn't been reviewed yet
To ensure quality for our reviews, only customers who have purchased this resource can review it
Report this resourceto let us know if it violates our terms and conditions.
Our customer service team will review your report and will be in touch.
