

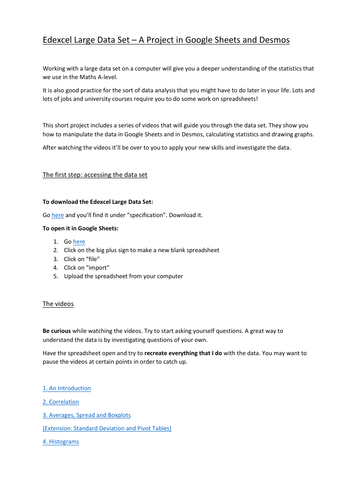
A project that guides students to investigate Edexcel’s Large Data Set using Google Sheets and Desmos, for homework or in a computer room.
The project includes a series or tutorial videos that teach students:
- why we use the data set
- what’s in the data set
- how to navigate the spreadsheet
- how to calculate Pearson’s Correlation Coefficient in Google Sheets
- how to draw scatter graphs in Google Sheets
- how to calculate summary statistics in Desmos
- how to draw boxplots in Desmos
- how to draw histograms in Desmos
It then instructs students to investigate a question about the data and put their analysis together into a document to submit.
Initially developed during lockdown for students to do at home.
Available to download as a pdf or docx.
Something went wrong, please try again later.
This resource hasn't been reviewed yet
To ensure quality for our reviews, only customers who have downloaded this resource can review it
Report this resourceto let us know if it violates our terms and conditions.
Our customer service team will review your report and will be in touch.
£0.00