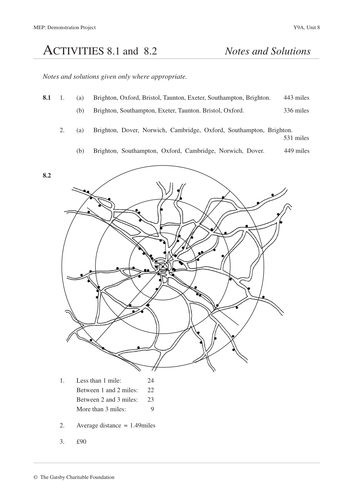


Worksheets and lesson plans on representing data. The topic of Statistical Diagrams from the Year 9 book of the Mathematics Enhancement Program. For information about these resources and an index for the whole collection please visit http://www.mrbartonmaths.com/CIMT.htm
Keywords: Questionnaire, Analysis, Question, Biased, Unbiased, Design, Leading, Line Graph, Bar Chart, Process, Display, Conclude, Evidence, Sample, Survey, Multiple Choice, Pilot, Study, Hypothesis, Trend, Bar Chart, Pie Chart, Line Graph, Presentation, Data
Something went wrong, please try again later.
Very useful. Many Thanks
Report this resourceto let us know if it violates our terms and conditions.
Our customer service team will review your report and will be in touch.
£0.00
