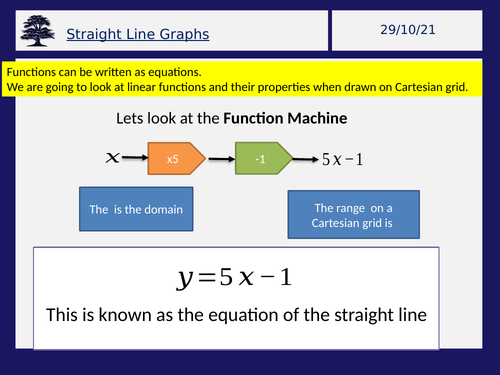

This is a fully animated lesson on plotting straight line graphs. It is the third lesson in a series which starts on function notation and builds to straight line graphs. This looks at the need for a table compared with a mapping diagram. Suitable for GCSE but it is worth noting mapping diagrams dont lend themselves to quadratics so they need to be familiar with both
Something went wrong, please try again later.
This resource hasn't been reviewed yet
To ensure quality for our reviews, only customers who have downloaded this resource can review it
Report this resourceto let us know if it violates our terms and conditions.
Our customer service team will review your report and will be in touch.
£0.00