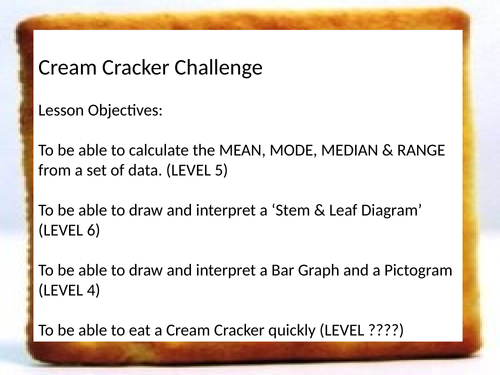

Lesson Objectives:
KS3 Maths activity. Using the data handling cycle. Lesson powerpoint and worksheets.Students will collect data (time taken to eat a cream cracker).
To be able to calculate the MEAN, MODE, MEDIAN & RANGE from a set of data. (LEVEL 5)
To be able to draw and interpret a ‘Stem é Leaf Diagram’ (LEVEL 6)
To be able to draw and interpret a Bar Graph and a Pictogram (LEVEL 4)
Something went wrong, please try again later.
Love it, will definitely try it. Thank you
Excellent resource, the students will love it, especially eating the cream crackers.
brilliant resource, completed the activity in class and then gave the rest as homework for an investigation over the holidays, with an extension to complete with family members if they could!
Nice activity i'm sure groups will love the element of eating cream crackers. It could be messy though
Report this resourceto let us know if it violates our terms and conditions.
Our customer service team will review your report and will be in touch.
