

This lesson is designed for year 8 students.
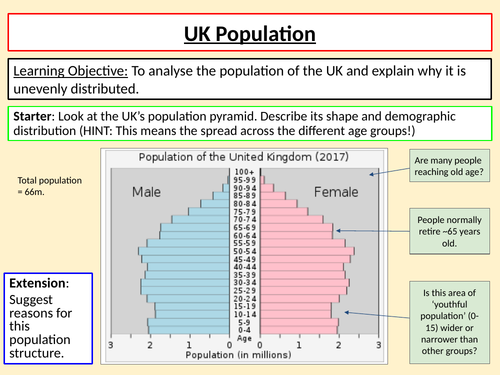
It introduces the UK population data, including historical and projected trends, then part 2 focuses on why the population is unevenly distributed (sparse vs. dense areas). The task on locating the top 10 cities is largely for interest and if there’s time!
Something went wrong, please try again later.
Fantastic resources. Thanks a bunch.
Great- thank you!
This is fab, thanks!
Report this resourceto let us know if it violates our terms and conditions.
Our customer service team will review your report and will be in touch.
£0.00