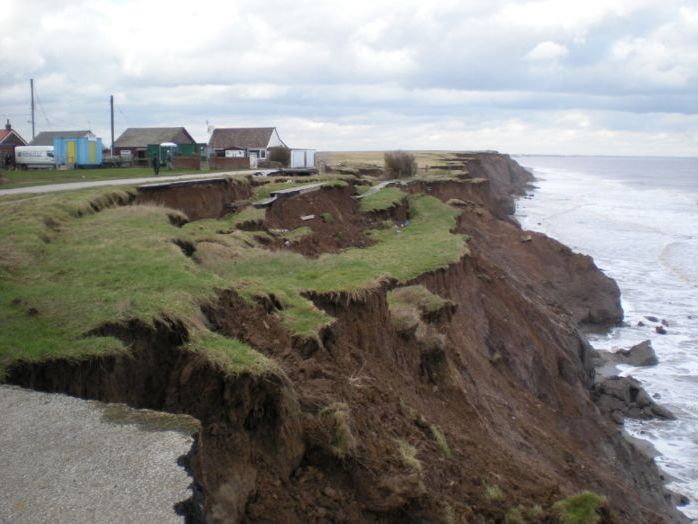


This lesson uses GIS with step by step instructions so that students can measure the erosion of the coast and then plot this on a graph using Google Sheets. This is done by overlapping a historic map with current satellite imagery and measuring the difference. This can be attempted by a student who has never used ArcGIS before.
Something went wrong, please try again later.
This resource hasn't been reviewed yet
To ensure quality for our reviews, only customers who have purchased this resource can review it
Report this resourceto let us know if it violates our terms and conditions.
Our customer service team will review your report and will be in touch.
£1.00