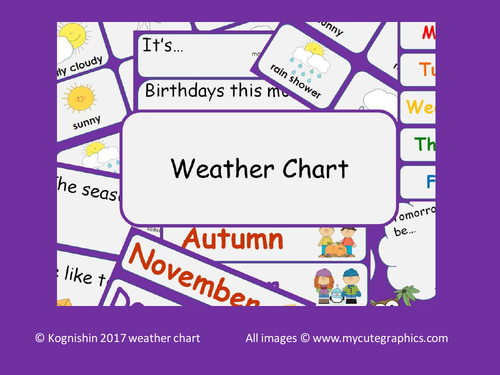

I created this chart when curriculum 2014 came into effect to help me cover regularly the weather elements in the Science and Geography section with my KS1 children as well as ‘time’ within Maths. it is meant to be laminated or covered in sticky-back, clear adhesive so that it can be written on with a whiteboard marker. The months are colour coded to seasons and images are chosen to help the children learn the words and recall what happens over the year. My helpers of the day were responsible for updating the sticky images that were stuck on with sticky backed velcro. The sections with no small words in were written in at the beginning of every month by me. I did need to make three copies of the weather cards in case all three days had the same weather. Sometimes we had a discussion and sometimes the children completed the chart independently in the mornings. In maths, we used it to help organise and learn the days and months. The prediction of weather took a while for them to learn the difference between what they wanted the weather to be like compared to what the weather would probably be like in that season but did improve. It was also helpful to learn that sunny needn’t mean warm which is why it has extended sections e.g. weather feeling cards too.
Something went wrong, please try again later.
This resource hasn't been reviewed yet
To ensure quality for our reviews, only customers who have purchased this resource can review it
Report this resourceto let us know if it violates our terms and conditions.
Our customer service team will review your report and will be in touch.