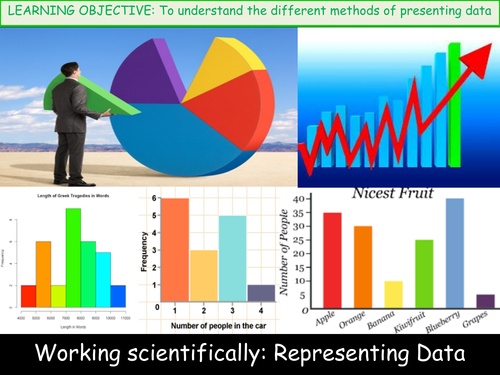
This is the second lesson in the Working Scientifically topic of Activate 2, directed at a mixed ability Yr 8 Science class.
The presentation includes a challenge question, support and extension tasks on all relevant slides. collaborative learning opportunities.
Success Criteria
To identify different methods of presenting data.
To plot bar charts and/or frequency diagrams accurately.
To plot scatter diagrams or line graphs accurately.
Please rate and comment on what you find useful so I can alter my lessons in future.
Many thanks
Something went wrong, please try again later.
This resource hasn't been reviewed yet
To ensure quality for our reviews, only customers who have purchased this resource can review it
Report this resourceto let us know if it violates our terms and conditions.
Our customer service team will review your report and will be in touch.
£2.00
