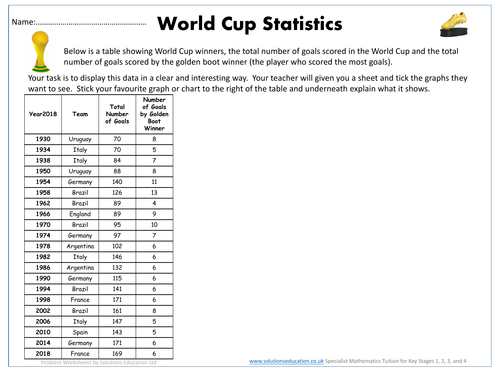
This is a nice activity to use whilst practicing “representing data” generally or towards the end of the year when looking for nice lessons that help teachers improve students work and identify misconceptions.
The work is differentiated with the topic chosen to help engage students.
Printing the first sheet in A3 will also allow some great “wall worthy work” to be produced.
We hope you find this useful, saves time and improves your students presenting data skills.
Updated to include the 2018 World Cup.
Something went wrong, please try again later.
Great resource Worked very well with my high ability top set year 7's as a nice final lesson on data handling. Many thanks
This was exactly what I was looking for. I might get my year 8's to make a stem and leaf diagram with number of goals scored as well as the pie chart,
Report this resourceto let us know if it violates our terms and conditions.
Our customer service team will review your report and will be in touch.
