Structured PowerPoints which can be used to structure your lesson and/or guide and help students.
Teaching videos (from me) on q=mc∆T and Hess’ Law https://youtu.be/BjbXJTB0JdA:
https://youtu.be/gf2clDpAMbI
This includes a mini selection of resources including a crossword on learning aim G (fuels), an independent task where students can get on with preparing presentations on the hazards of fuels (has a checklist, 4 choices of what to present on and is differentiated), a results table including structured calculations and report template, a glossary which can be used throughout and added to each time a new key term is introduced and a scientific investigation card sort (which can be used at the beginning as part of the introduction to the unit).
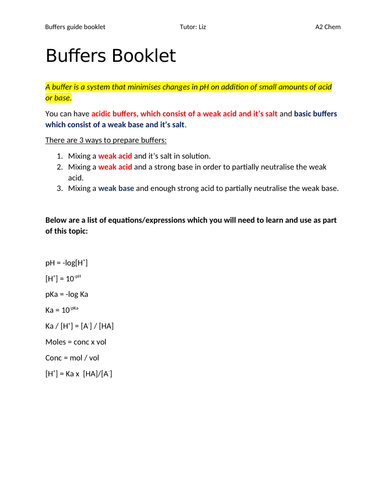
A booklet covering an intro to buffers, all the equations you need to learn and the main types of buffer calculations with stepwise methods and an answer booklet with all working.
This PowerPoint is most useful for new teachers, teachers who have not taught VSEPR before (ideas for how to structure your lesson) or teachers who want ideas on how to make this topic more interactive and include ideas for kinaesthetic activities.
This PowerPoint includes VSEPR yoga, VSEPR triominoes (I have not included the resource as it is a pack of cards, however I have included instructions and an image example so you can make your own) and VSEPR cut and sticks can also be made to keep your students engaged.
Other interactive ideas could include online quizzes such as Kahoot, Bingo etc.
Designed for Unit 2 Practical Scientific Procedures & Techiques L3 Applied Science.
Lesson activity for part of Assignment A teaching and completed ‘5 min lesson plan’
Credit to ‘teacher toolkit’ for the format of the lesson plan.
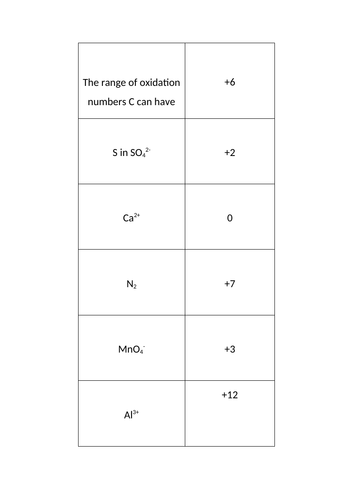
A ‘fun’ resource to check your student’s learning on redox and oxidation numbers.
These domino cards can be printed on card/paper and then laminated (especially if printed on paper).
Available in blue and creamy yellow for students with dyslexia.
This is a lab book for unit 2 that will help students greatly once assignments are issued. Students can record their results in here during/after the practicals, either handwritten on a printed version or typed on an online copy.
This saves loads of time with planning lessons :-)
I hope that you find it helpful.
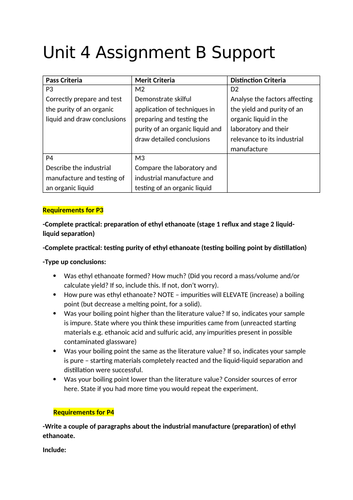
These sheets were created for a class that fell behind and were struggling with unit 4.
2 fool-proof sheets for B and C handy for when students need to finish asap
Created for A Level Chemistry and suitable for all exam boards.
Can also be used on any course that studies benzene and looks at it’s stability compared to that of the Kekule structure.
A booklet that can be done for homework or in class to help consolidate the theory from learning aim G. Includes possible exam questions that may come up in the Part B written paper.
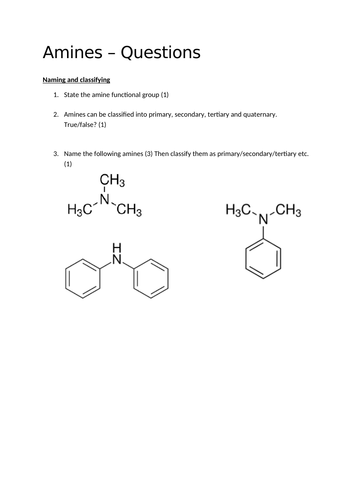
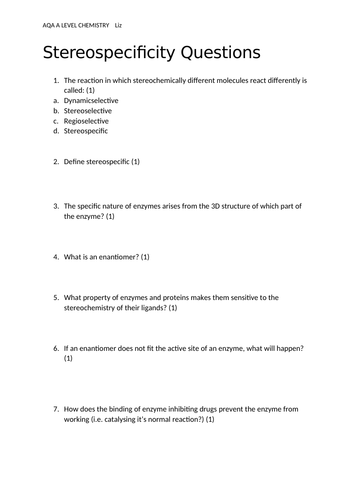
Questions and answers
Designed for AQA A Level Chemistry but can be used for any other course on which students need to understand stereospecificity in enzymes
A resource created to assist teachers and students with delivery of the A2 OCR Chemistry PAGs.
A PowerPoint to help you structure the beginning of the PAG lesson on 10.2 thiosulfate and acid. Can easily be amended and used as a template if preferred. Alternatively, this could be given to students as a guideline to assist them with their planning and calculations.
Example results and graph for thiosulfate (part 1) included, showing the first order relationship.
Possible extension opportunities include monitoring how temperature affects the rate of reaction - an Arrhenius plot could then be done as part of the analysis. Recommended for A-A* students.
Gives students a checklist of what needs to be submitted.
PowerPoint for PAG 9.3 rates attached also. This one includes OCR past paper questions (and answers) at the end as a plenary.
A powerpoint presentation (consisting of activities and answers and a link to the RSC video on NMR) and worksheet (comic strip to help students condense information and remember the main points of NMR) to assist teaching with the new L3 Applied Science Unit 19.
This was created to help teach NMR spectroscopy. It has activities throughout and is step-by-step, I have simplified where possible.
Has a couple of extension/early finishers activities in.
I have created a series of 3 videos in which I teach NMR, the first can be found here and is about chemical equivalency :) https://www.youtube.com/watch?v=-fWA108hr8M
Attached is 2 double lessons (4 hours) worth of activities, lesson is interactive, student-led, exam-focused.
Prior to this, students should choose a contemporary scientific issue of their choice - this can be from a magazine eg New Scientist or Chemistry Review etc. or from online.
They can produce a little written piece introducing this if you wish them to.
The teacher can then go through the PowerPoint regarding part B of the exam -this PowerPoint explains the structure of part B of the exam and describes what to include and how to structure your answers in order to achieve high marks.
In some cases, ideas of how to start answers are given.
Students should answer each of the questions (except the last one) for THEIR chosen contemporary issue (see peer assessment form for how to do this in presentation style. This can be done in a presentation format and communicated to the class, during the presentation, the presenter will be assessed by their classmates using the peer-assessment form attached.
Many skills are addressed in this lesson(s), such as communication, critical thinking, analysis, detecting bias, independent research, ability to give and receive constructive criticism, drawing valid conclusions, making sensible judgements, simplifying complex issues and interpreting graphical and statistical data etc.
Link to video introducing Unit 7: https://www.youtube.com/watch?v=AMFkvxYIVfU
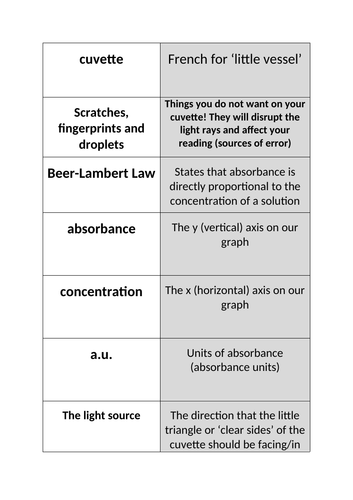
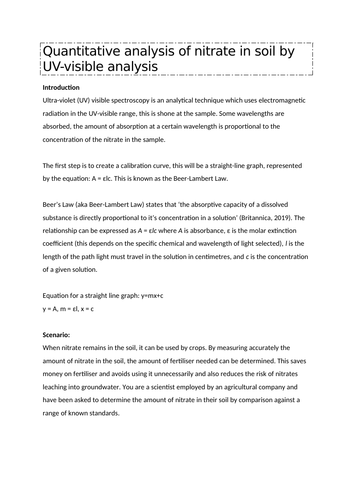
Attached is a full lesson 5 page worksheet containing a detailed step-by-step method (including how to use the UV-vis), introduction including theory on Beer’s Law, space for students to tabulate and record their results, questions around the topic, answers and sample results. There are a couple of photographs (taken by me when I was trialling this) to help students visualise how things should look when they are carrying out the method.
This can take around 1 hour - 2.5 hour lesson depending on equipment availability and how you wish to deliver it. :-)
Please leave a review!
Some pointers and ideas to help you devise a method and practical for the new unit 19 applied science unit.
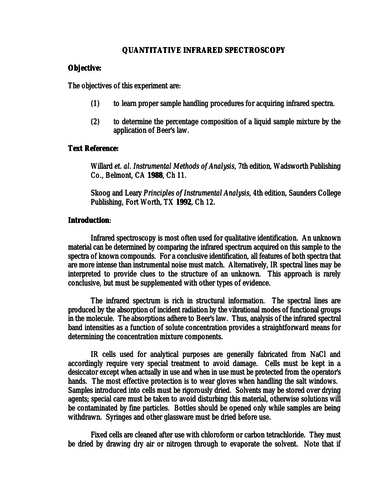
This practical is one of the 4 options for assignment B. I know that the use of IR for quantitative analysis is uncommon, but it can be done.
Find attached a journal article of a similar experiment and a short outline of a method (word doc). Journal is obviously not my own work, I have just uploaded these to help centres devise their own methods for this assignment.
I hope this is helpful for you.
Please take a look at my other resources :-)
I created this lesson for the new unit 19 level 3 applied science, assignment B, spectroscopy. This lesson lasts about 1.5 hours including completion of activities and introduces the students to spectroscopy by recapping the electromagnetic spectrum (I have also included some points in the notes section of the powerpoint which you may wish to discuss).
The data sheet I used with my students was the OCR A A Level Chemistry one (just what was handy in the lab) and the PowerPoint refers to worksheet A which is part of their assignment. This can be found on the Pearson website, along with answers.
I have included a link to a video I created introducing IR spectroscopy, aimed at students :) https://www.youtube.com/watch?v=XxYTIuKYbvc
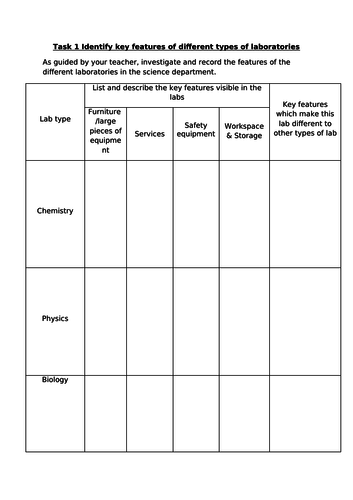
Laboratory design activity that could be used for an after school STEM club, mini science project, summer project or even a class task. Aimed at school level but can be as simple or challenging as you would like to make it :)
A supporting PowerPoint is attached with ideas for student instructions ie group tasks visiting laboratories, what to focus on/take notes + photos of. This can be quite hands on and you can let students measure things and do conversions, creating keys and grids in their own laboratory design plans, if you have the facility to do so.