I have been a teacher for over 20 years - all the stuff I upload has been tried and tested in my classroom. I don't mind a discussion on Twitter too where I also share new resources. I now have a personal website: https://andylutwyche.com/
I have been a teacher for over 20 years - all the stuff I upload has been tried and tested in my classroom. I don't mind a discussion on Twitter too where I also share new resources. I now have a personal website: https://andylutwyche.com/
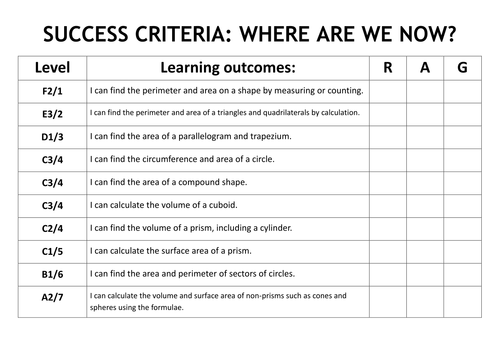
This is a powerpoint covering perimeter, area, volume from simple rectangles, triangles and other quadrilaterals, then going on to surface area including frustums and spheres. It contains brief notes by way of an explanation, model answers to questions and a question or two for the students to do; all of the questions come with answers that you can display when ready. The slide show comes with a progress grid (regularly referred to in the presentation) so that students can mark their progress from start to finish and pinpoint any areas that may need extra work with a “red/amber/green” system that they fill in; each one is given an approximate grade in both new (2017 onwards) and old system in England. It’s what I use in my lessons before setting tasks from worksheets or text books to practise.
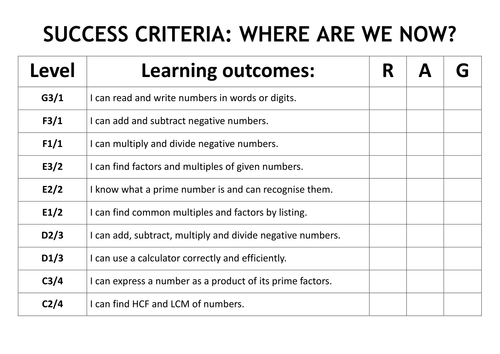
This is a powerpoint covering muliples, factors, primes, HCF, LCM before going on to directed/negative numbers. It contains brief notes by way of an explanation, model answers to questions and a question or two for the students to do; all of the questions come with answers that you can display when ready. The slide show comes with a progress grid (regularly referred to in the presentation) so that students can mark their progress from start to finish and pinpoint any areas that may need extra work with a “red/amber/green” system that they fill in; each one is given an approximate grade in both new (2017 onwards) and old system in England. It’s what I use in my lessons before setting tasks from worksheets or text books to practise.
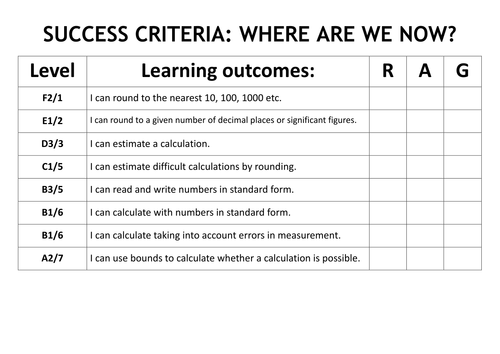
This is a powerpoint covering rounding from to whole numbers, decimal places and significant figures, then estimating calculations (including bounds) to standard form. It contains brief notes by way of an explanation, model answers to questions and a question or two for the students to do; all of the questions come with answers that you can display when ready. The slide show comes with a progress grid (regularly referred to in the presentation) so that students can mark their progress from start to finish and pinpoint any areas that may need extra work with a “red/amber/green” system that they fill in; each one is given an approximate grade in both new (2017 onwards) and old system in England. It’s what I use in my lessons before setting tasks from worksheets or text books to practise.
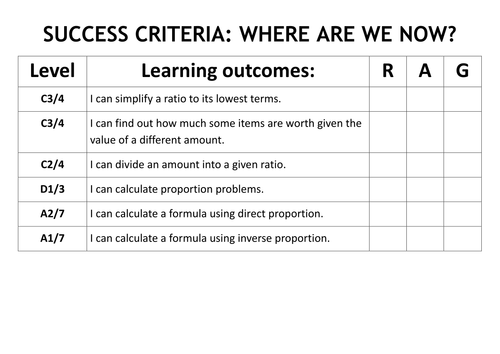
This is a powerpoint coveringratio from simplifying to sharing before moving onto proportion. It contains brief notes by way of an explanation, model answers to questions and a question or two for the students to do; all of the questions come with answers that you can display when ready. The slide show comes with a progress grid (regularly referred to in the presentation) so that students can mark their progress from start to finish and pinpoint any areas that may need extra work with a “red/amber/green” system that they fill in; each one is given an approximate grade in both new (2017 onwards) and old system in England. It’s what I use in my lessons before setting tasks from worksheets or text books to practise.
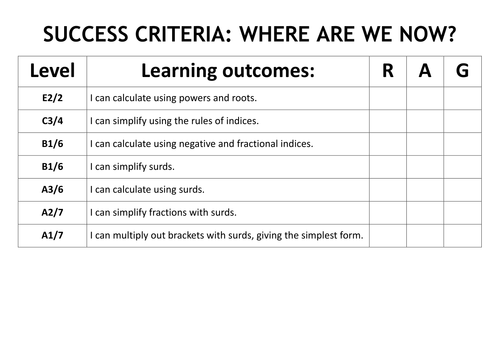
This is a powerpoint covering rules of indices and simplifying before moving on to surds including simplifying, calculating and rationalising denominators. It contains brief notes by way of an explanation, model answers to questions and a question or two for the students to do; all of the questions come with answers that you can display when ready. The slide show comes with a progress grid (regularly referred to in the presentation) so that students can mark their progress from start to finish and pinpoint any areas that may need extra work with a “red/amber/green” system that they fill in; each one is given an approximate grade in both new (2017 onwards) and old system in England. It’s what I use in my lessons before setting tasks from worksheets or text books to practise.
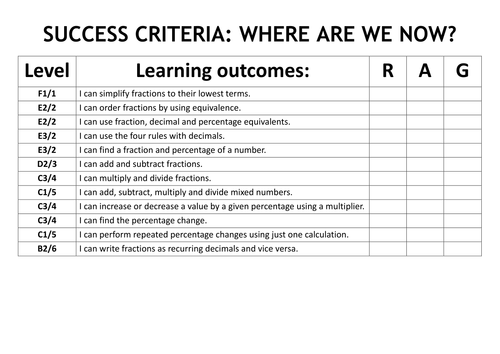
This is a powerpoint covering all aspects of fractions, decimals and percentages including equivalence and calculations. It contains brief notes by way of an explanation, model answers to questions and a question or two for the students to do; all of the questions come with answers that you can display when ready. The slide show comes with a progress grid (regularly referred to in the presentation) so that students can mark their progress from start to finish and pinpoint any areas that may need extra work with a “red/amber/green” system that they fill in; each one is given an approximate grade in both new (2017 onwards) and old system in England. It’s what I use in my lessons before setting tasks from worksheets or text books to practise.
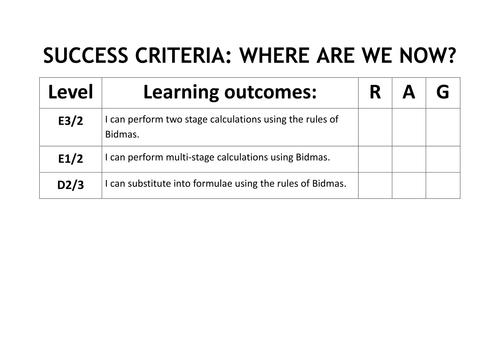
This is a powerpoint covering order of operations. It contains brief notes by way of an explanation, model answers to questions and a question or two for the students to do; all of the questions come with answers that you can display when ready. The slide show comes with a progress grid (regularly referred to in the presentation) so that students can mark their progress from start to finish and pinpoint any areas that may need extra work with a “red/amber/green” system that they fill in; each one is given an approximate grade in both new (2017 onwards) and old system in England. It’s what I use in my lessons before setting tasks from worksheets or text books to practise.
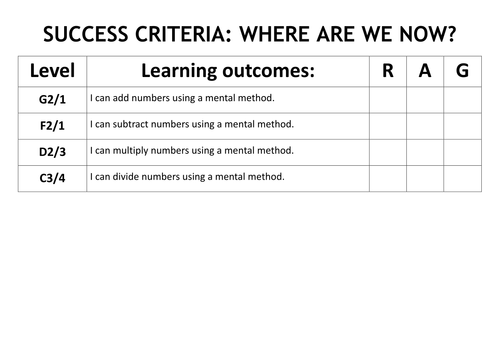
This is a powerpoint covering the topics listed. It contains brief notes by way of an explanation, model answers to questions and a question or two for the students to do; all of the questions come with answers that you can display when ready. The slide show comes with a progress grid (regularly referred to in the presentation) so that students can mark their progress from start to finish and pinpoint any areas that may need extra work with a “red/amber/green” system that they fill in; each one is given an approximate grade in both new (2017 onwards) and old system in England. It’s what I use in my lessons before setting tasks from worksheets or text books to practise.
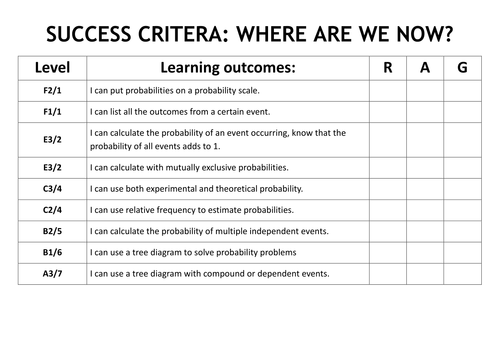
This is a powerpoint covering probability from basic single events to tree diagrams of dependent events. It contains brief notes by way of an explanation, model answers to questions and a question or two for the students to do; all of the questions come with answers that you can display when ready. The slide show comes with a progress grid (regularly referred to in the presentation) so that students can mark their progress from start to finish and pinpoint any areas that may need extra work with a “red/amber/green” system that they fill in; each one is given an approximate grade in both new (2017 onwards) and old system in England. It’s what I use in my lessons before setting tasks from worksheets or text books to practise.
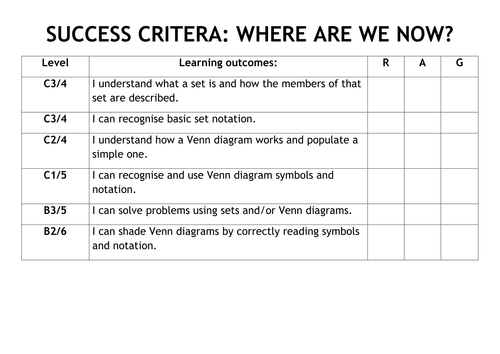
This is a powerpoint covering all aspects of sets and venn diagrams required for GCSE. It contains brief notes by way of an explanation, model answers to questions and a question or two for the students to do; all of the questions come with answers that you can display when ready. The slide show comes with a progress grid (regularly referred to in the presentation) so that students can mark their progress from start to finish and pinpoint any areas that may need extra work with a “red/amber/green” system that they fill in; each one is given an approximate grade in both new (2017 onwards) and old system in England. It’s what I use in my lessons before setting tasks from worksheets or text books to practise.
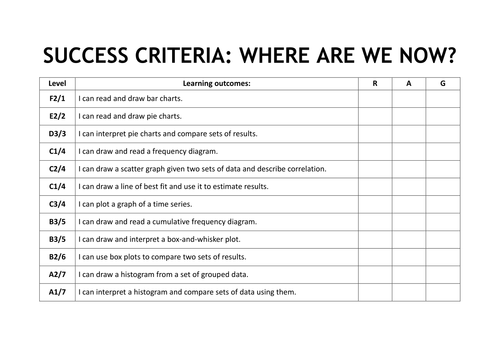
This is a powerpoint covering all types of statistical graph from pictogram to histogram with lots inbetween. It contains brief notes by way of an explanation, model answers to questions and a question or two for the students to do; all of the questions come with answers that you can display when ready. The slide show comes with a progress grid (regularly referred to in the presentation) so that students can mark their progress from start to finish and pinpoint any areas that may need extra work with a “red/amber/green” system that they fill in; each one is given an approximate grade in both new (2017 onwards) and old system in England. It’s what I use in my lessons before setting tasks from worksheets or text books to practise.
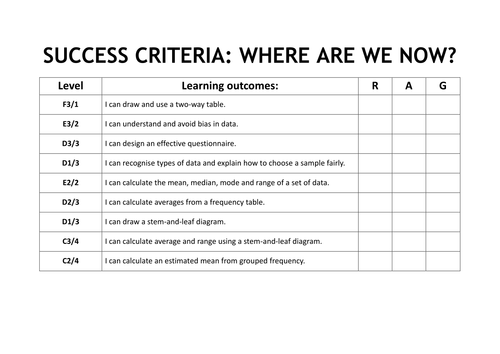
This is a powerpoint covering surveys, avearges including from tables, stem-and-leaf diagrams and grouped data. It contains brief notes by way of an explanation, model answers to questions and a question or two for the students to do; all of the questions come with answers that you can display when ready. The slide show comes with a progress grid (regularly referred to in the presentation) so that students can mark their progress from start to finish and pinpoint any areas that may need extra work with a “red/amber/green” system that they fill in; each one is given an approximate grade in both new (2017 onwards) and old system in England. It’s what I use in my lessons before setting tasks from worksheets or text books to practise.
This is a powerpoint covering solving equations of increasing difficulty. It contains brief notes by way of an explanation, model answers to questions and a question or two for the students to do; all of the questions come with answers that you can display when ready. The slide show comes with a progress grid (regularly referred to in the presentation) so that students can mark their progress from start to finish and pinpoint any areas that may need extra work with a “red/amber/green” system that they fill in; each one is given an approximate grade in both new (2017 onwards) and old system in England. It’s what I use in my lessons before setting tasks from worksheets or text books to practise.
This is a powerpoint covering simultaneous equations of increasing diffuculty. It contains brief notes by way of an explanation, model answers to questions and a question or two for the students to do; all of the questions come with answers that you can display when ready. The slide show comes with a progress grid (regularly referred to in the presentation) so that students can mark their progress from start to finish and pinpoint any areas that may need extra work with a “red/amber/green” system that they fill in; each one is given an approximate grade in both new (2017 onwards) and old system in England. It’s what I use in my lessons before setting tasks from worksheets or text books to practise.
This is a powerpoint covering simplifying expressions along with forming and using formulae. It contains brief notes by way of an explanation, model answers to questions and a question or two for the students to do; all of the questions come with answers that you can display when ready. The slide show comes with a progress grid (regularly referred to in the presentation) so that students can mark their progress from start to finish and pinpoint any areas that may need extra work with a “red/amber/green” system that they fill in; each one is given an approximate grade in both new (2017 onwards) and old system in England. It’s what I use in my lessons before setting tasks from worksheets or text books to practise.
This is a powerpoint covering sequences from continuing, using the nth term, finding the nth term and briefly covering quadratic sequences. It contains brief notes by way of an explanation, model answers to questions and a question or two for the students to do; all of the questions come with answers that you can display when ready. The slide show comes with a progress grid (regularly referred to in the presentation) so that students can mark their progress from start to finish and pinpoint any areas that may need extra work with a “red/amber/green” system that they fill in; each one is given an approximate grade in both new (2017 onwards) and old system in England. It’s what I use in my lessons before setting tasks from worksheets or text books to practise.
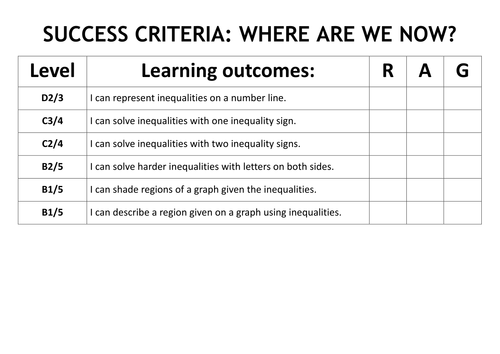
This is a powerpoint covering inequalities from number lines, solving and shading regions. It contains brief notes by way of an explanation, model answers to questions and a question or two for the students to do; all of the questions come with answers that you can display when ready. The slide show comes with a progress grid (regularly referred to in the presentation) so that students can mark their progress from start to finish and pinpoint any areas that may need extra work with a “red/amber/green” system that they fill in; each one is given an approximate grade in both new (2017 onwards) and old system in England. It’s what I use in my lessons before setting tasks from worksheets or text books to practise.
This is a powerpoint covering expanding single and double brackets and factorising into single and double brackets. It contains brief notes by way of an explanation, model answers to questions and a question or two for the students to do; all of the questions come with answers that you can display when ready. The slide show comes with a progress grid (regularly referred to in the presentation) so that students can mark their progress from start to finish and pinpoint any areas that may need extra work with a “red/amber/green” system that they fill in; each one is given an approximate grade in both new (2017 onwards) and old system in England. It’s what I use in my lessons before setting tasks from worksheets or text books to practise.
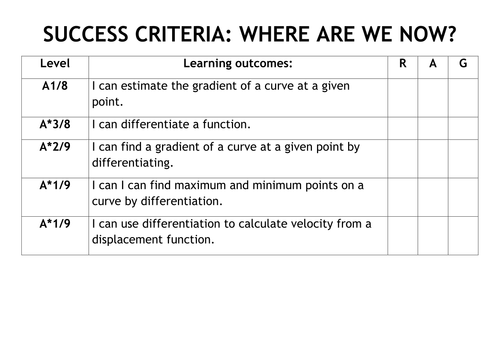
This is a powerpoint covering basic calculus for GCSE. It contains brief notes by way of an explanation, model answers to questions and a question or two for the students to do; all of the questions come with answers that you can display when ready. The slide show comes with a progress grid (regularly referred to in the presentation) so that students can mark their progress from start to finish and pinpoint any areas that may need extra work with a “red/amber/green” system that they fill in; each one is given an approximate grade in both new (2017 onwards) and old system in England. It’s what I use in my lessons before setting tasks from worksheets or text books to practise.
This is a powerpoint covering co-ordinates, mid-points, linear graphs (given and finding the equation), quadratic graphs. It contains brief notes by way of an explanation, model answers to questions and a question or two for the students to do; all of the questions come with answers that you can display when ready. The slide show comes with a progress grid (regularly referred to in the presentation) so that students can mark their progress from start to finish and pinpoint any areas that may need extra work with a “red/amber/green” system that they fill in; each one is given an approximate grade in both new (2017 onwards) and old system in England. It’s what I use in my lessons before setting tasks from worksheets or text books to practise.